
Figure 2.
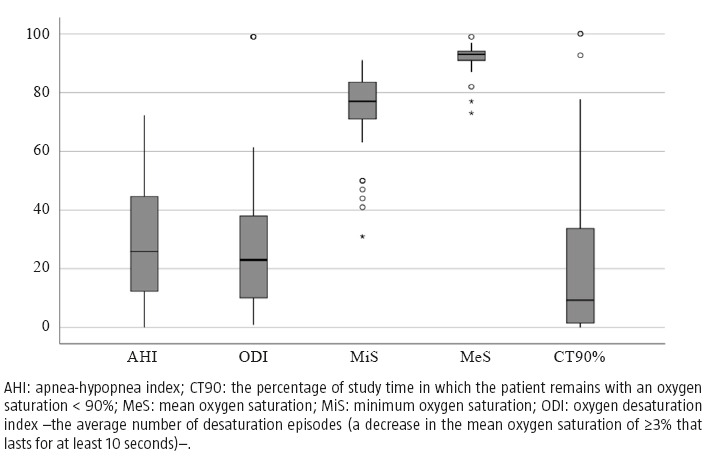
Box-and-whisker plot of sleep parameters in the intervention group. The box is drawn from Q1 (quartile) to Q3 with a horizontal line drawn in the middle to denote the median. All other observed points are plotted as outliers. Open circles represent individual outliers and asterisks denote far-out.