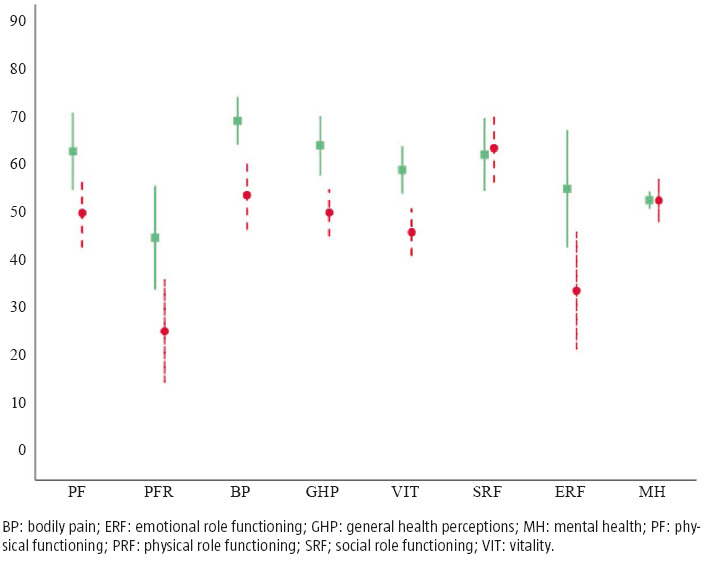
Figure 3.

SF-36 quality of life score results among stroke patients according to whether they belong to the intervention or control group. Patients of the intervention group had higher scores in six of the eight SF-36 domains (p <0.05). The green squares represent the intervention group. The red circles represent the control group.
