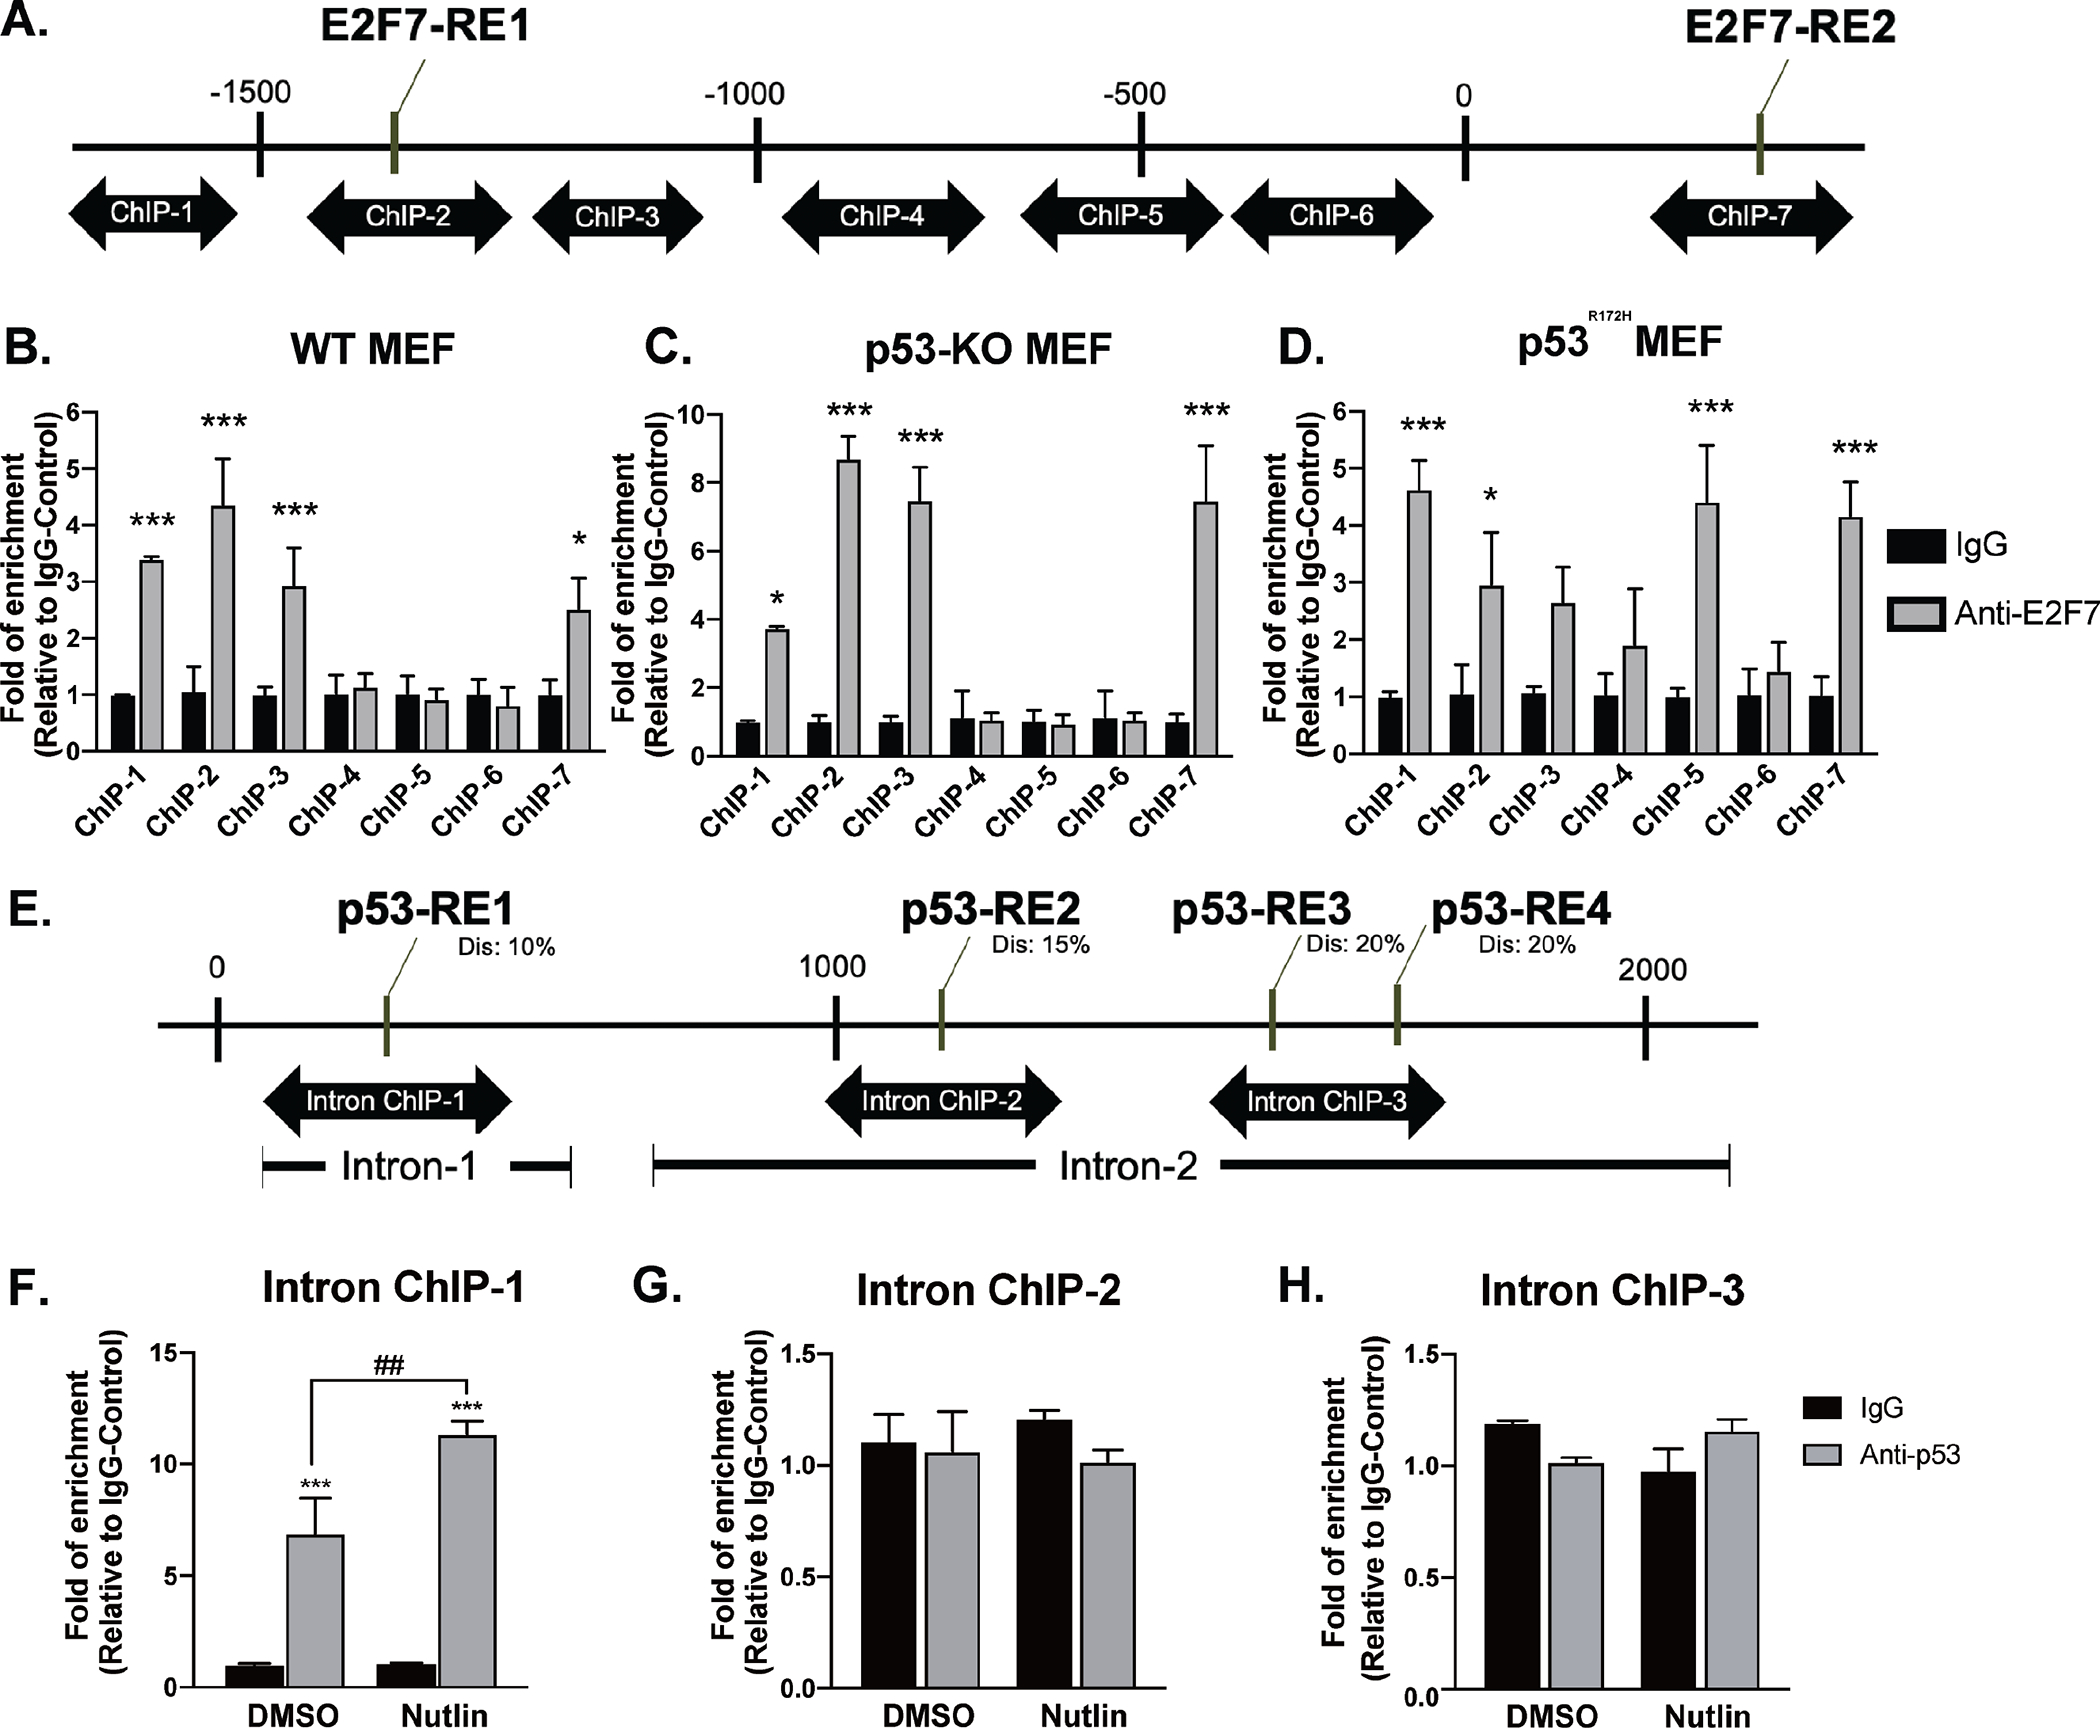
Figure 4. E2F7 binds to the promoter and second intron of Enpp2.

(A) Diagram of the ChIP-qPCR primers targeting the E2F7-RE. (B)WT, (C) p53-KO, and (D) p53R172H cells were subjected to ChIP-qPCR analysis with anti-E2F7 and nonspecific control IgG antibodies. The E2F7-bound DNA was quantified by qPCR using specific primers (ChIP-1~ChIP-7) targeting the promoter and intron sequences of Enpp2. (E) Diagram of the ChIP-qPCR primers targeting potential p53-RE. WT cells were starved for 1h followed by incubating with 20 μM Nutlin 3A for 24 h. The cells were further subjected to ChIP-qPCR analysis with anti-p53 or nonspecific control IgG antibodies. The primers targeting (F) p53-RE1 in the first intron, (G) p53-RE2, (H) p53-RE3 and p53-RE4 in the second intron were used to quantify the p53-bound DNA. Enrichment of E2F7- and p53-binding was normalized to non-specific control IgG. Analyses represent the mean of three independent experiments. One-way ANOVA was performed to compare the data from multiple experiments to determine the significance of E2F7 binding at a given site. *p < 0.05 and ***p < 0.001 indicate significant differences. Dis: dissimilarity.
