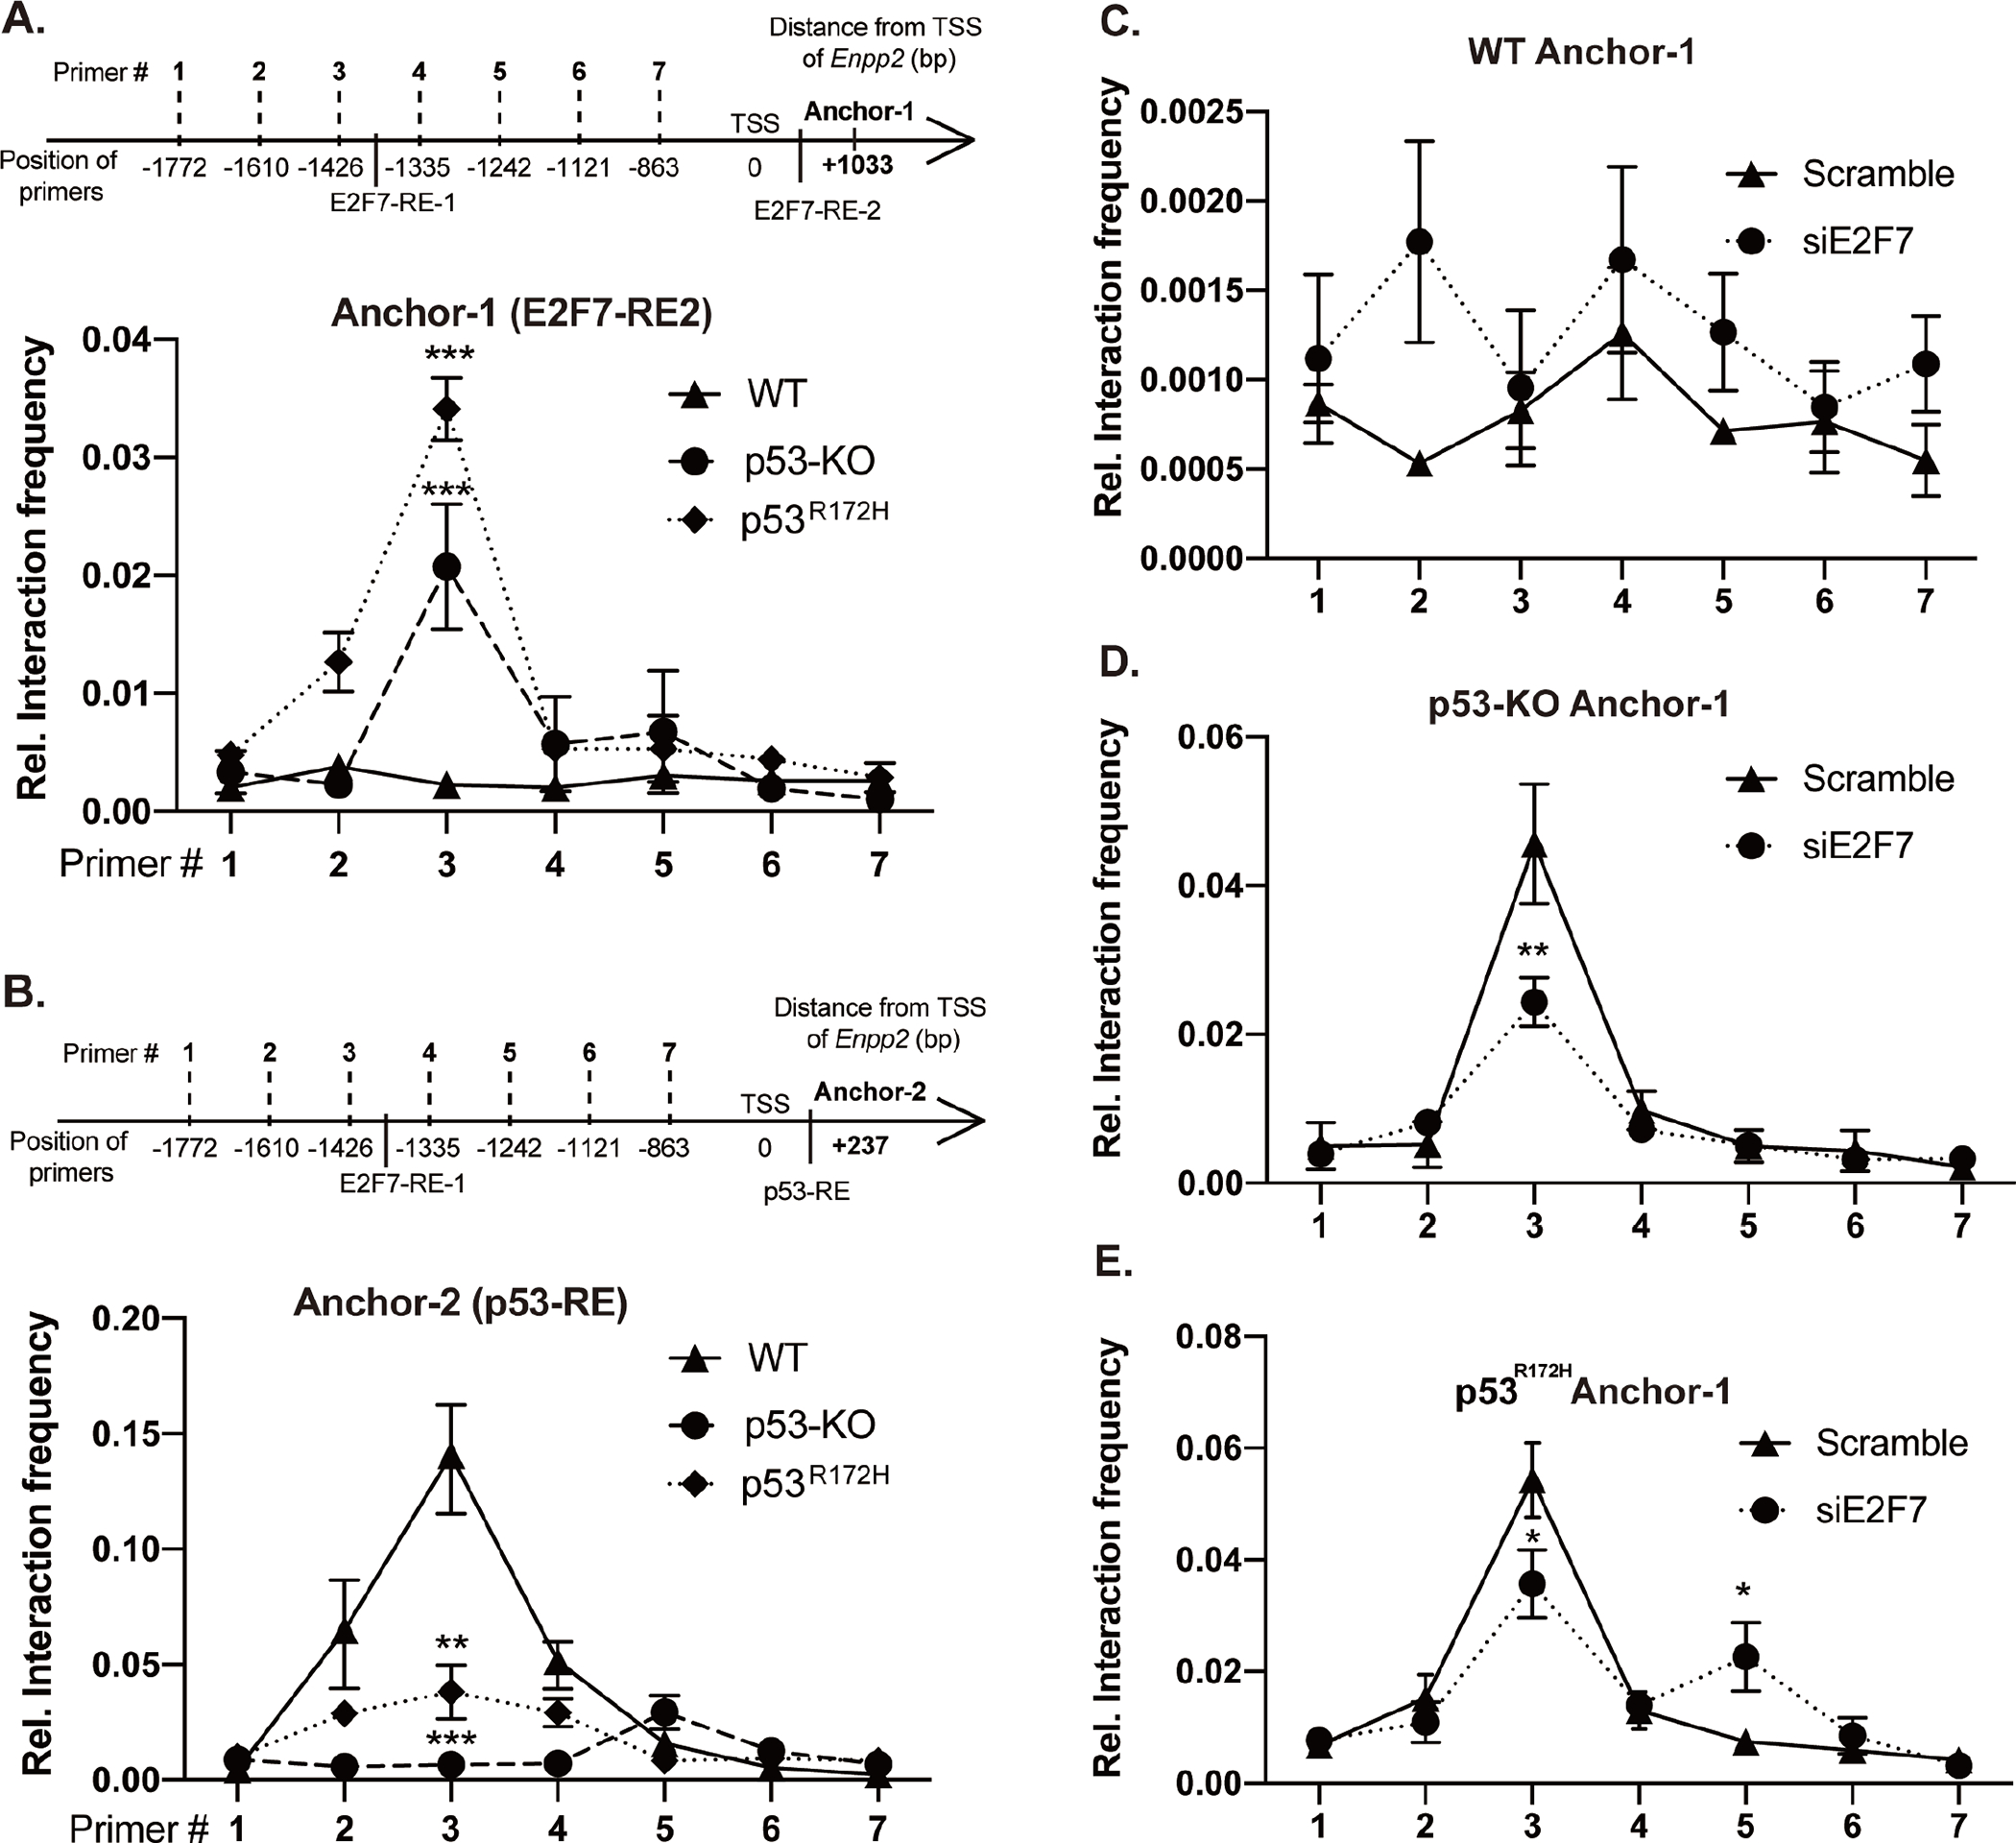
Figure 5. Chromatin conformation capture (3C) reveals chromosomal looping of the two E2F7 binding sites in MEF.

(A) Top: Schematic of 3C-qPCR primers targeting the DpnII restriction sites and E2F7 binding sites in the mouse Enpp2. Bottom: 3C-qPCR was performed in WT, p53-KO, and p53R172H cells using Anchor-1 (associated with the E2F7-RE2) and forward primers targeting E2F7-RE1 and promoter fragments. (B) Top: The schematic shows the primers targeting p53-RE and E2F7 binding sites in the mouse Enpp2 gene. Bottom: 3C-qPCR was applied to measure the interaction frequency between Anchor-2 (associated with the intronic p53-RE) and forward primers targeting E2F7-RE1 and promoter fragments. 3C assay measuring the crosslinking frequency in (C) WT, (D) p53-KO, and (E) p53R172H MEF transfected with E2F7 siRNA. Relative interaction frequency was normalized to GAPDH and plotted as the mean ± SD (how many independent experiments?). *p < 0.05, **p<0.01, and ***p < 0.001 indicate significant differences using ANOVA (n=3).
