
Figure 1.
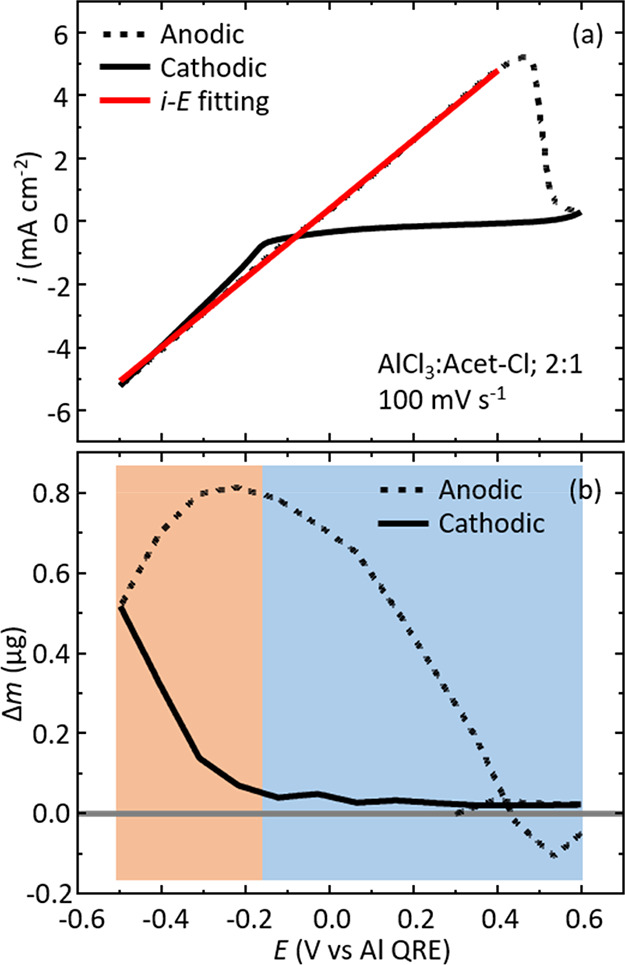
(a) Exemplar experimental cyclic voltammogram (solid and dashed black traces represent cathodic and anodic scans, respectively) demonstrating the i–E curve-fitting (solid red line) method with the AlCl3:Acet-Cl 2:1 electrolyte at a scan rate of 100 mV s–1. (b) Corresponding QCM plot at 100 mV s–1 showing the mass change as a function of potential. The orange shaded region visually represents deposition potentials, whereas the blue shaded region represents dissolution potentials. A solid gray line is included at the zero mass mark for clarity.