
Figure 7.
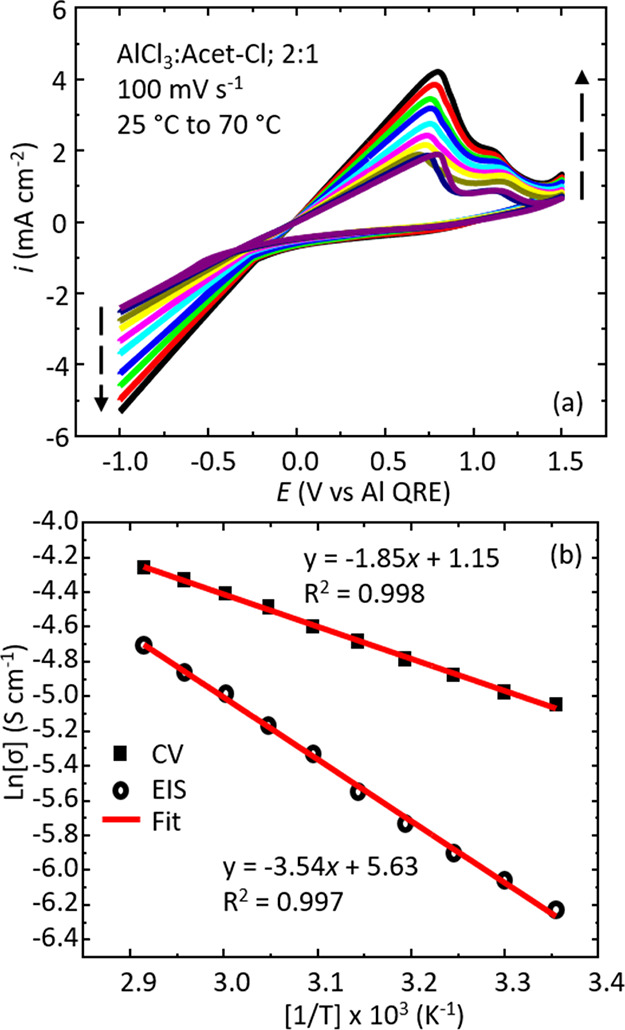
(a) Overlay of cyclic voltammograms measured from 25 to 70 °C at 100 mV s–1. The dashed black arrows point toward increasing temperatures. (b) Arrhenius plots of temperature-dependent conductivity data from EIS data (empty black circles) and CV data (filled black squares). The best fit line is shown for the two data sets along with the line equation and R2 coefficient.