
Figure 8.
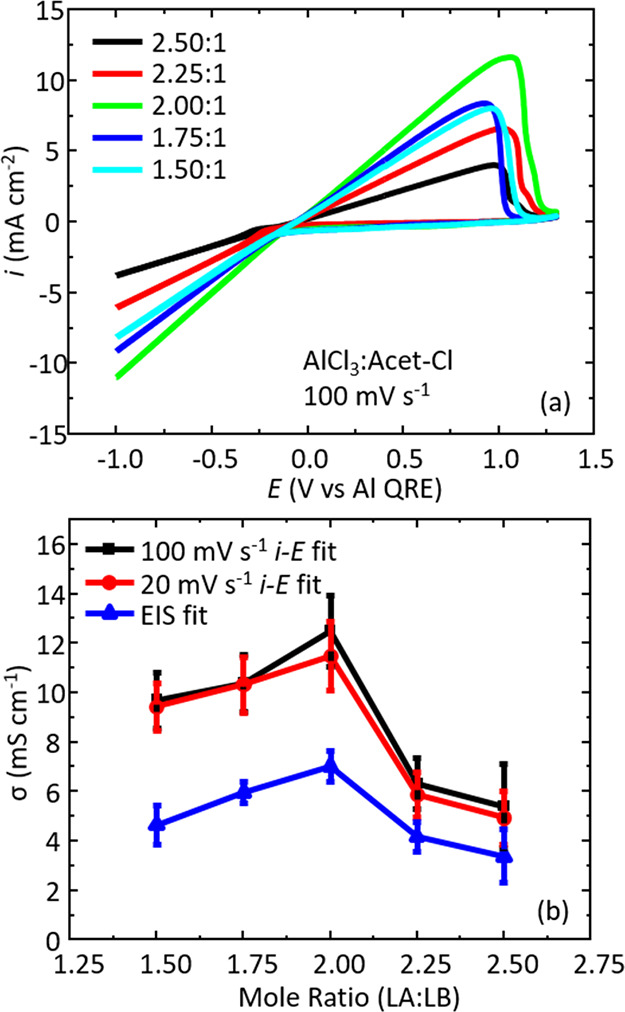
(a) Cyclic voltammograms at a scan rate of 100 mV s–1 for different mole ratios of LA:LB for the AlCl3:Acet-Cl system. (b) Overlays of the conductivity as a function of mole ratio for three different methods: 100 mV s–1i–E fitting (black squares), 20 mV s–1i–E fitting (red circles), and EIS fitting data (blue triangles). Error bars represent the standard deviation of 3 replicate measurements.