
Figure 3.
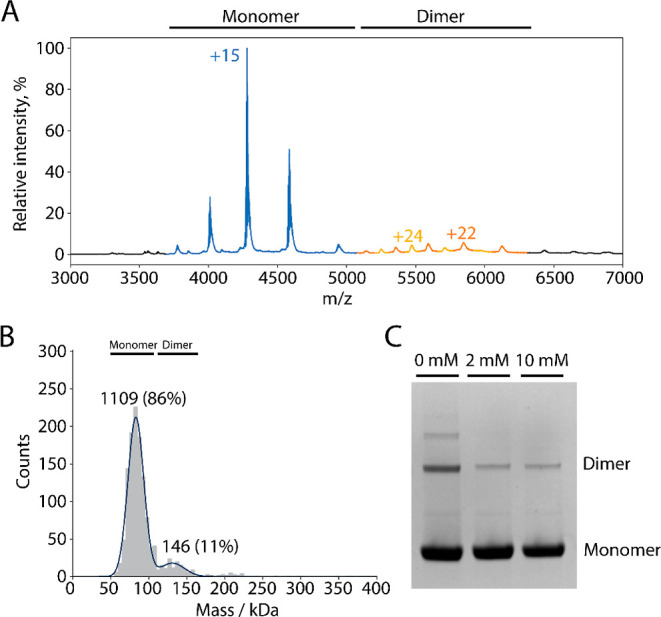
(A) Native mass spectrum of ErCry4a. The peaks of the monomer region are indicated in blue (molecular mass 64.197 ± 0.029 kDa) and the peaks of the dimer region in orange and yellow (molecular masses ∼123 and ∼131 kDa). The expected mass of an ErCry4a WT monomer including FAD and a His-tag is 64.034 kDa. The differences between the detected and the expected masses are due to salt ions and buffer components. The finding of a second dimer mass, lower than the expected mass, could be due to minor truncations and is only observed in some samples. The observation here of stable dimers is consistent with Figure S13 of Xu et al.15 The sample used for this measurement contained 10 mM β-mercaptoethanol (BME) during shipment to prevent higher order oligomerization. (B) MP of 44 nM ErCry4a. The same sample as in (A) but shipped with 2 mM DTT. The numbers above the peaks are the numbers of counts. (C) SDS–PAGE gel of the ErCry4a samples without a His-tag (the same as used for XL-MS) that had been incubated with various amounts of DTT.