
Figure 3.
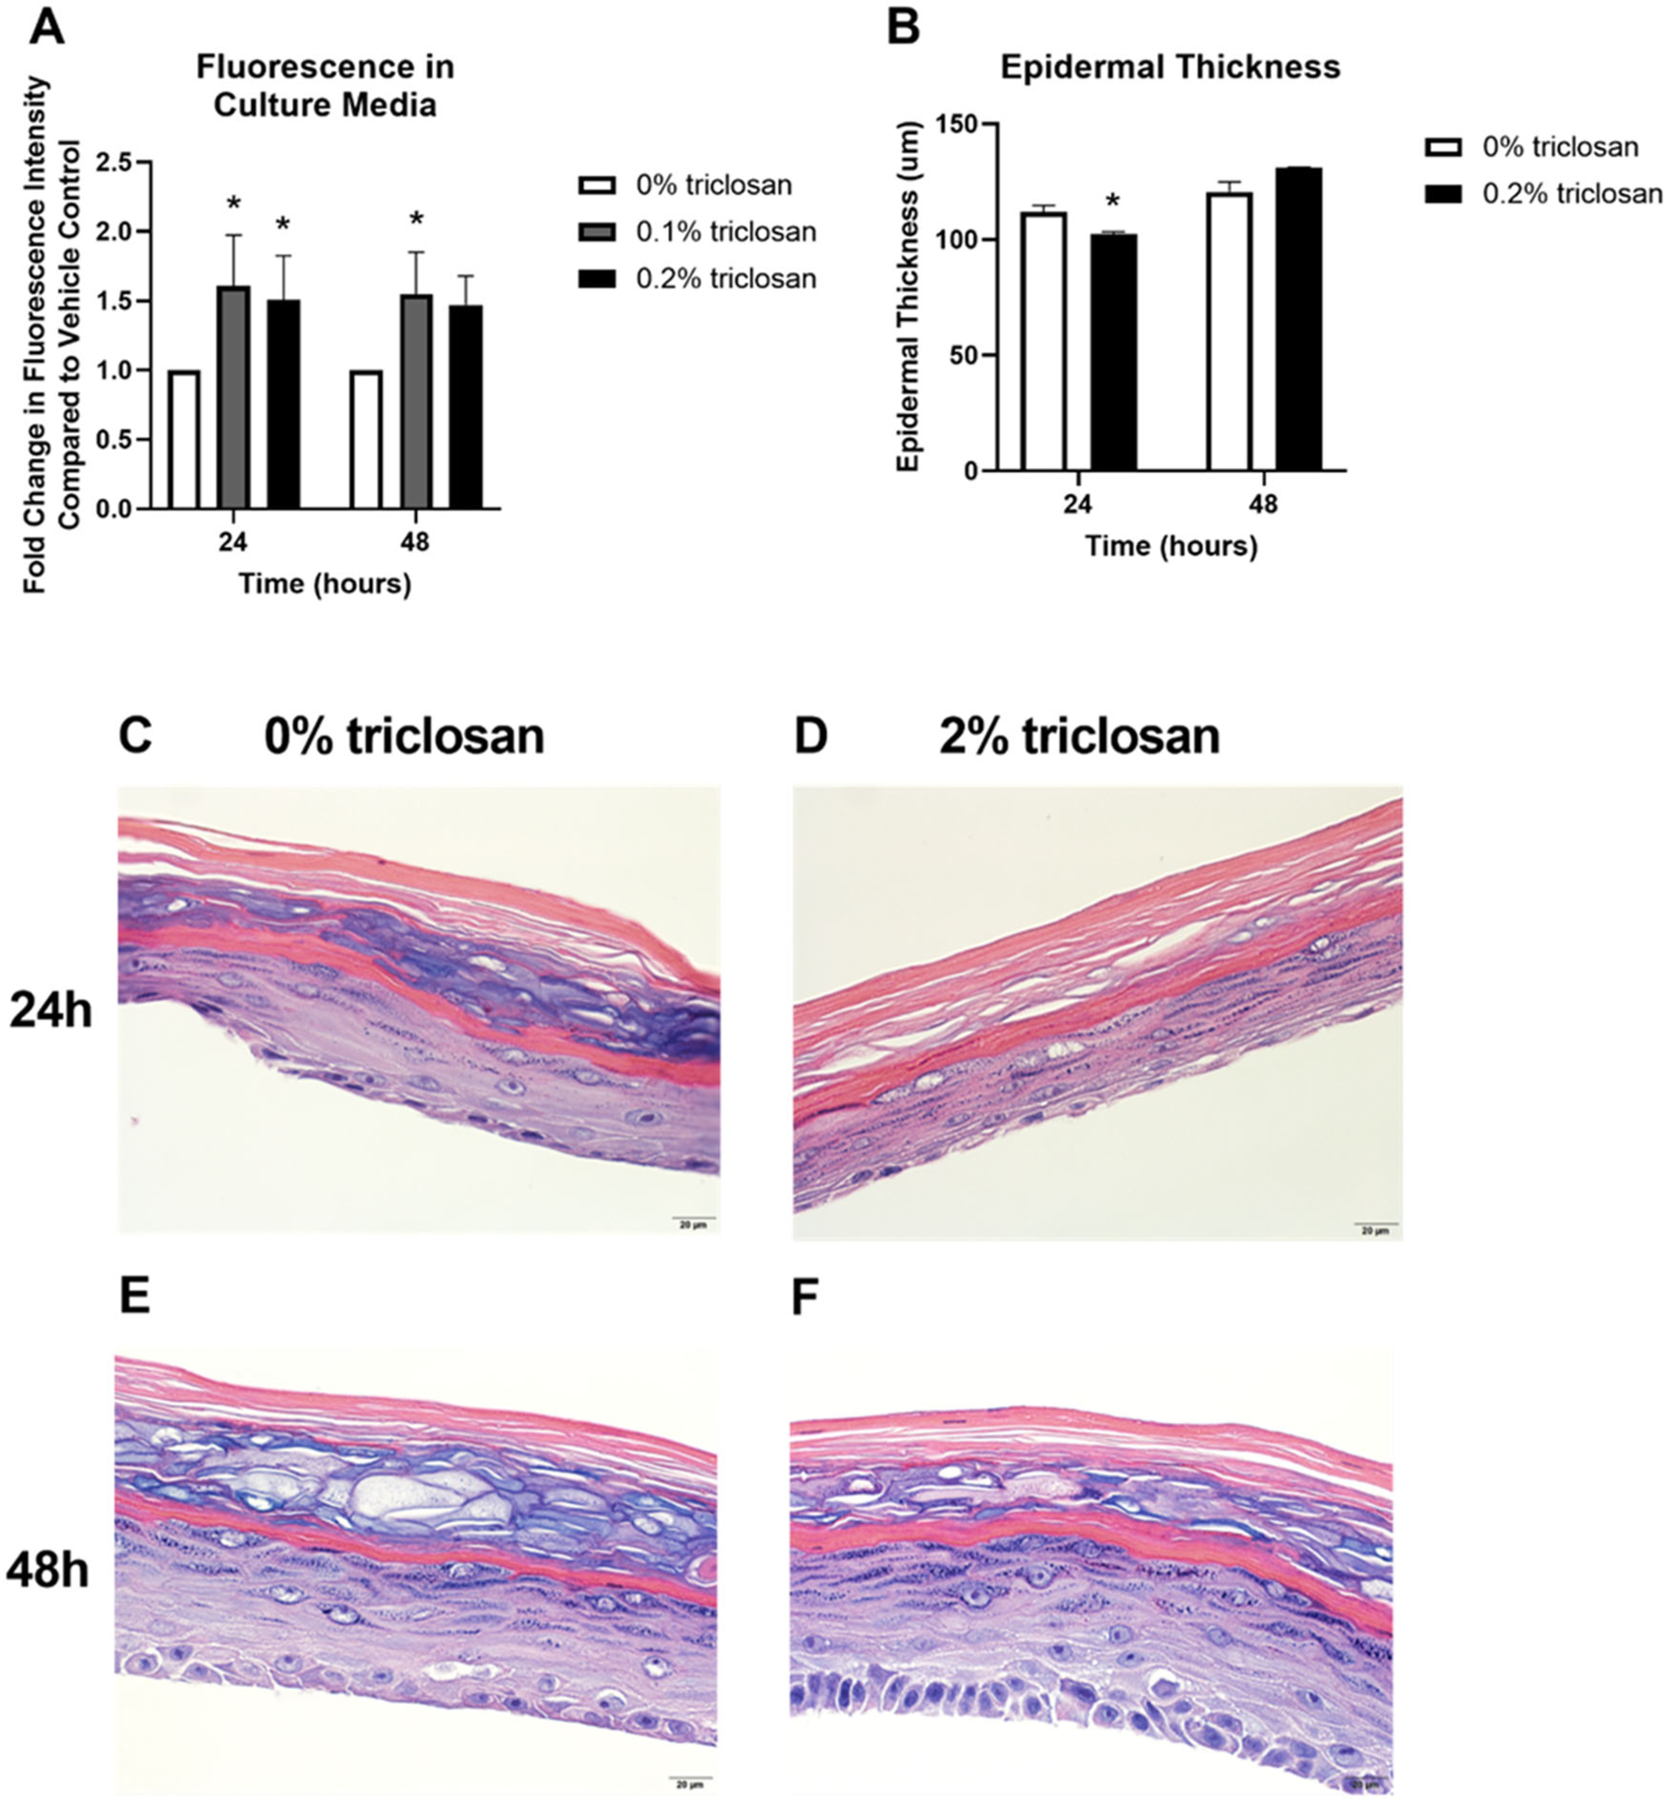
Exposure to triclosan on EpiDerm tissues altered barrier permeability. (A) Fold-change in fluorescence intensity compared to vehicle control following 24 and 48 h of 0% triclosan (vehicle) or 0.1–0.2% triclosan. Bars represent mean (± SEM) of two samples/group. *p < 0.05 vs. 0% triclosan. (B) Epidermal thickness (μm) following 24 and 48 hr of 0% triclosan (acetone vehicle) or 0.2% triclosan. Bars represent mean (± SEM) of two samples/group. *p < 0.05 vs. 0% triclosan. Representative hematoxylin and eosin images of EpiDerm tissues following 24 h of exposure to acetone vehicle (C) or 0.2% triclosan (D) and 48 h of exposure to acetone vehicle (E) or 0.2% triclosan (F). Scale bar = 20 μm.