
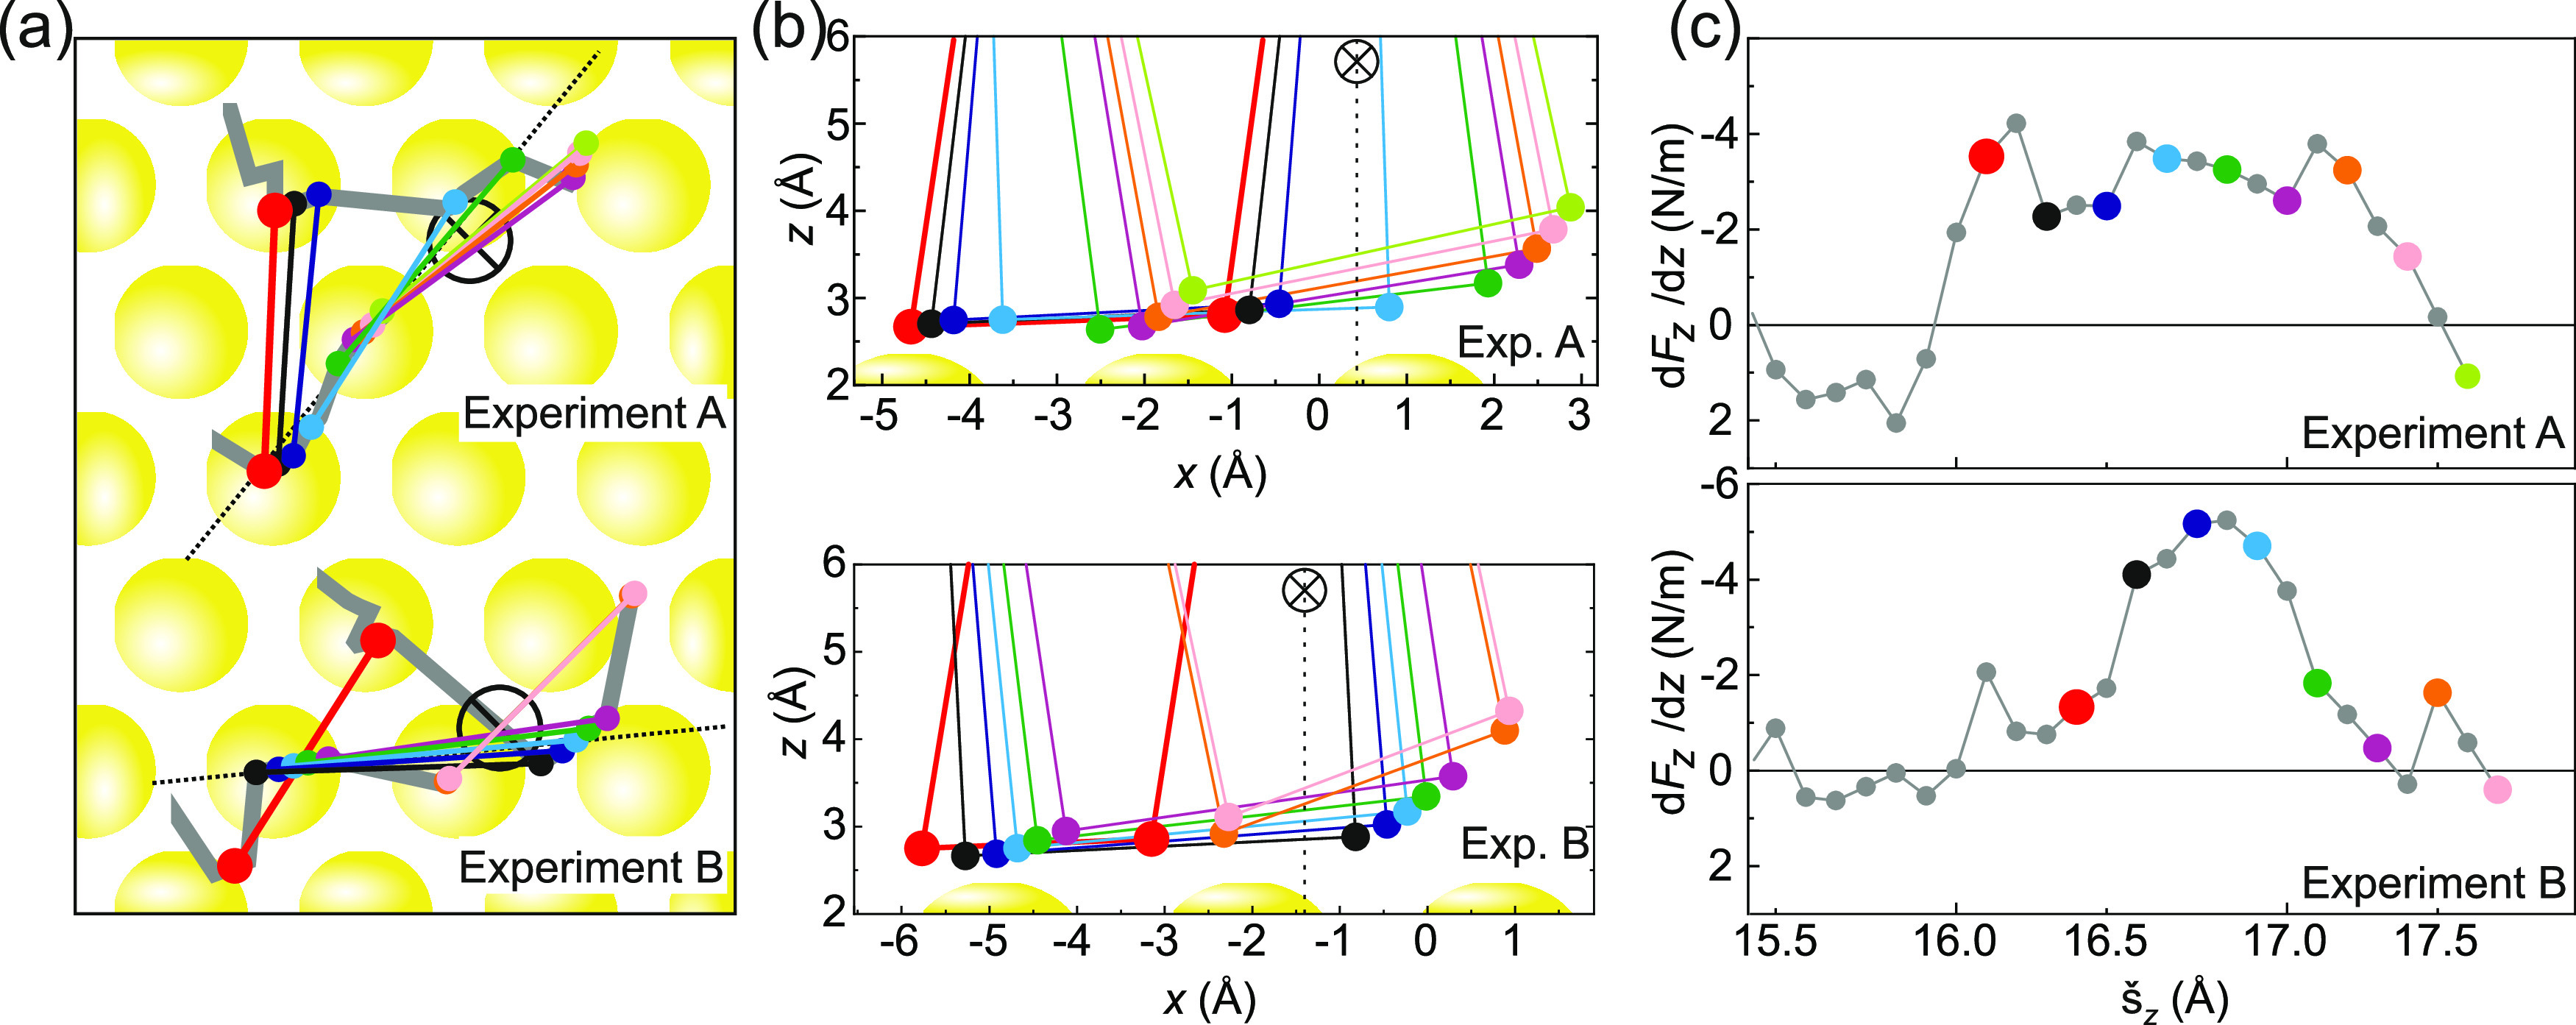
Figure 15.
Configuration analysis of vertical molecule. (a) Lateral positions of the two bottom Ocarb atoms for every second x̌j in the interval 80 ≤ j ≤ 96 (cf. Figures 13g and 14g). The tip position is marked by an encircled cross. The dotted line marks the projection plane used in panel (b). (b) Projection of all PTCDA configurations marked in panel (a) onto a plane that is perpendicular to the surface plane and intersects it along the dotted line in panel (a). PTCDA is abstracted as a quadrangle formed by its four Ocarb atoms, where only the lower part is shown. The indicated Au atoms are the ones closest to the intersecting planes and likewise projected as is the tip position (dashed line). (c) The best F̌′ curves from Figures 13e and 14e, respectively. Every second F̌j′ value with 80 ≤ j ≤ 96 is marked using the color code from panels (a) and (b). Experiment B reaches the limit of the FSA z-range already at j = 94, such that the last two points are omitted.