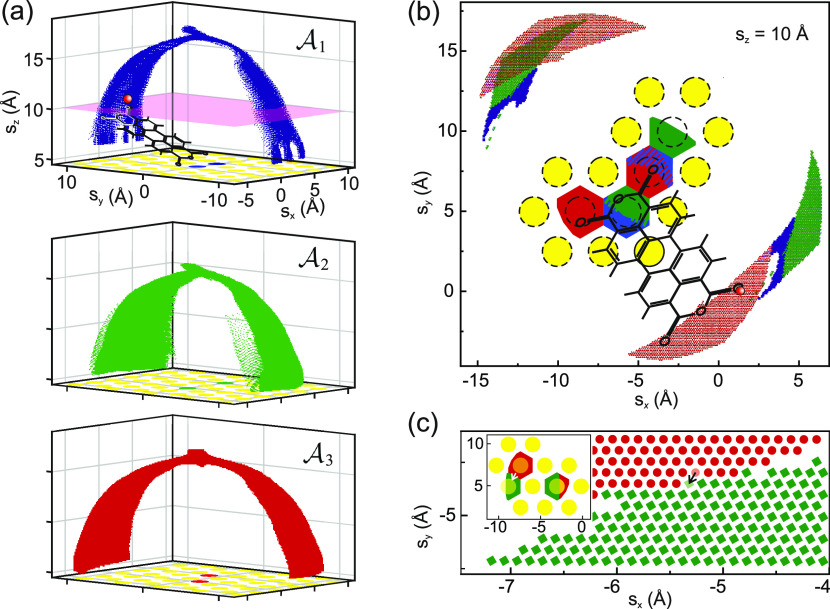
Figure 6.
Anchor sets. (a) Graphic representation of all
tip positions s in the three primary anchor sets  . The lateral positions of Au atoms are
displayed in yellow, with the anchor atoms in the corresponding color.
As exemplified in the upper panel, each point in the displayed cloud
of tip positions stands for a full configuration x of
the tip–molecule–surface junction. (b) Horizontal cut
through the s cloud of the three anchor sets at sz = 10 Å (the pink plane in panel (a)).
Au atoms are shown in yellow, and the reachable positions of the two
bottom Ocarb atoms (see Figure 4) are shown in the color of the respective
anchor set. An exemplary molecule in
  is drawn in black, with a red sphere marking
the corresponding tip position. (c) A tip displacement step (black
arrow) causes one anchor atom to change (white arrow in the inset,
length exaggerated for better visibility), such that the molecule
configuration moves from
  to
to  . Note that in panel (c), duplicate anchor
sets are displayed, which are rotated and translated with respect
to the primary anchor sets shown in panels (a) and (b).

