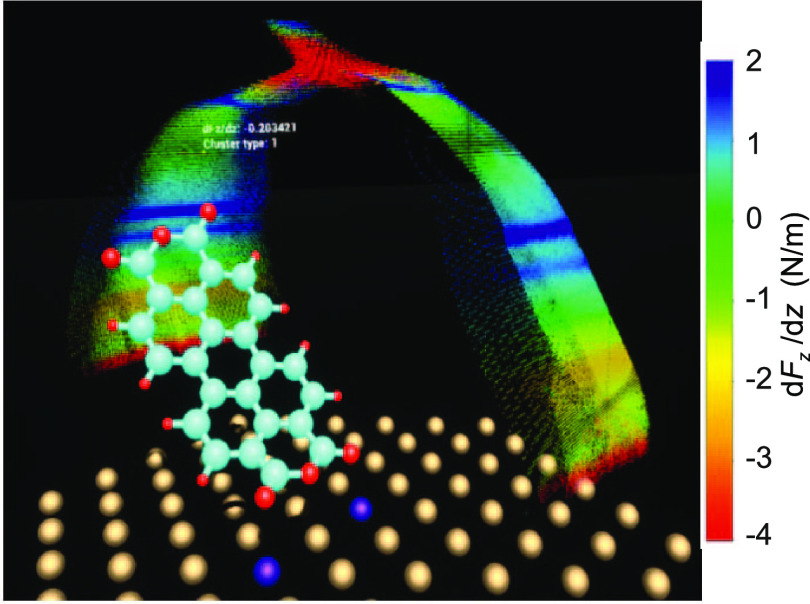
Figure 7.
Virtual reality representation of the FSA. Screenshot
of the custom-made
VR software that allows browsing the FSA and performing simulated
manipulations in an interactive manner. Each tip position in the selected
anchor set (here  ) is represented by a dot, the color of
which encodes the force gradient in the respective configuration.
Motion capture of the operator hand is used to control the tip position s for which the molecular configuration r is
displayed. Anchor atoms are shown in violet.

