
FIGURE 2.
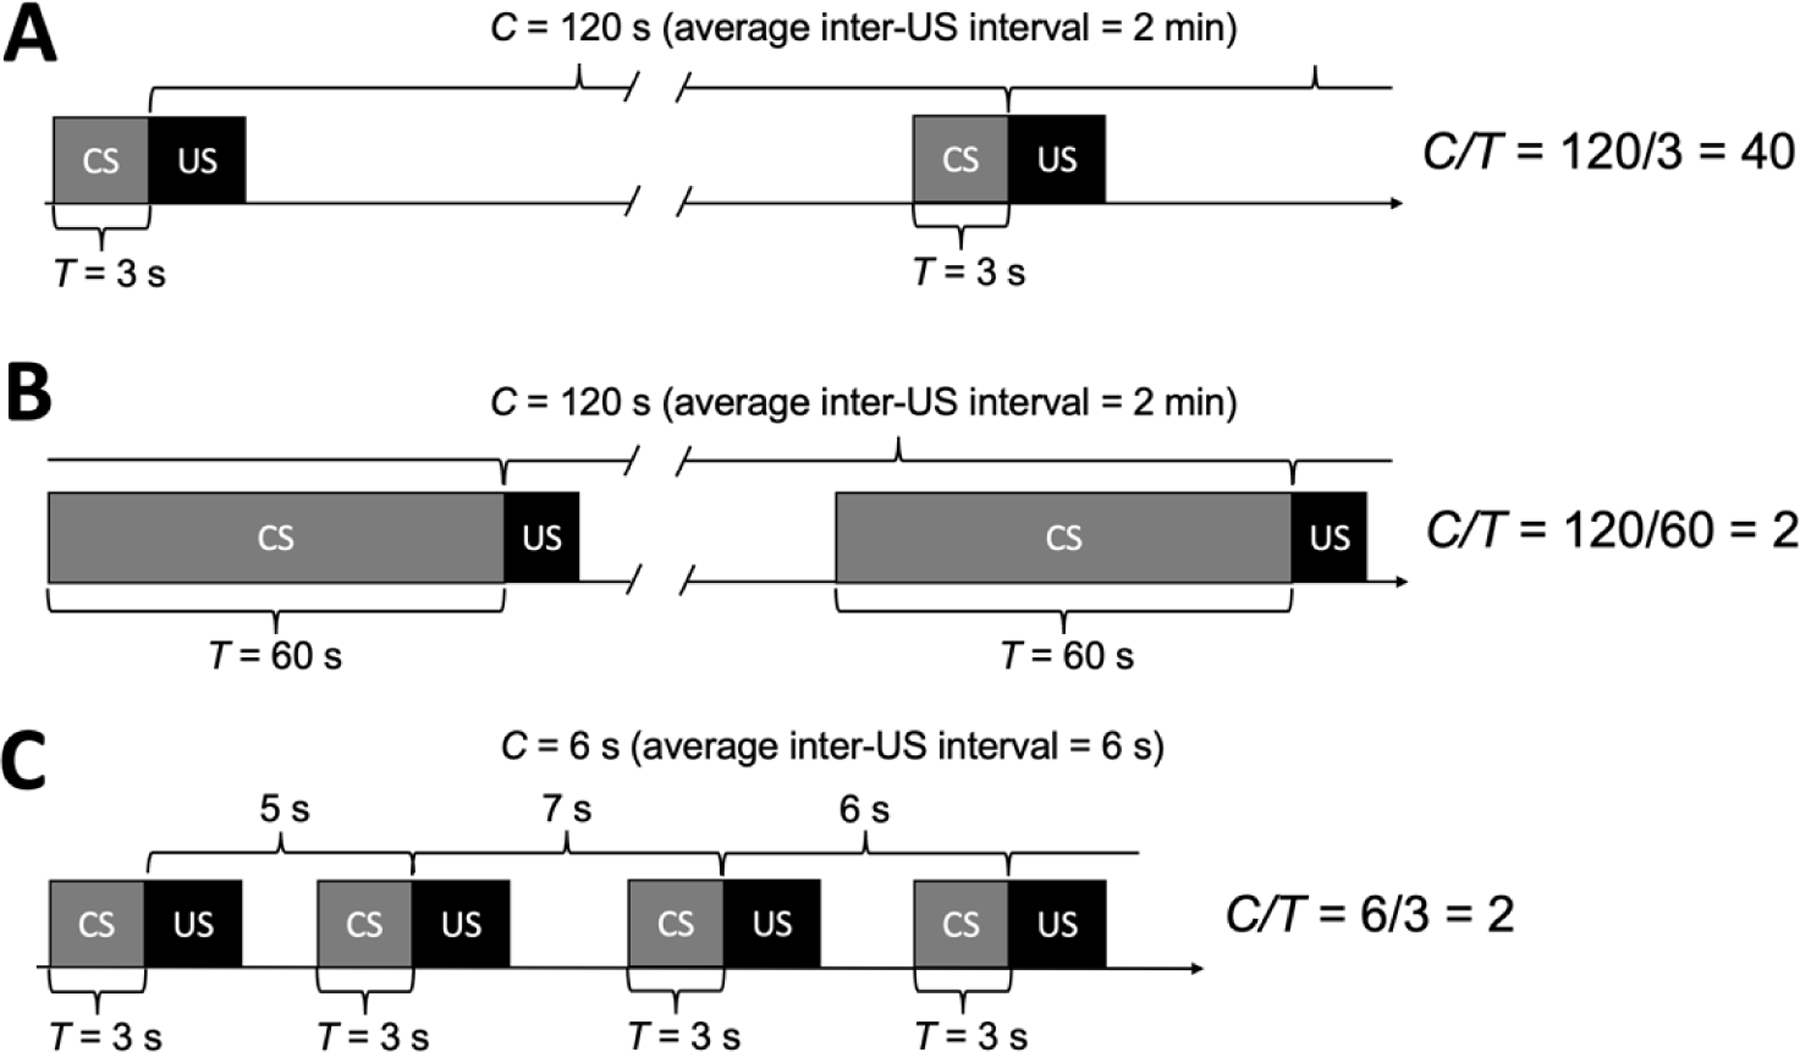
Three Pavlovian conditioning procedures. Panels A and B illustrate the two durations in the C/T ratio. C is the “cycle time” or the average interval separating successive unconditioned stimulus (US) events; T is the interval from conditioned stimulus (CS) onset to US delivery. By dividing C by T, we obtain a C/T ratio value (the quotient). In Panel C, the CS→US temporal contiguity is the same as in Panel A but the average inter-US interval (C) is shorter. Hence, Principle 3 holds that Panel A is the more effective procedure because of its longer duration of C.