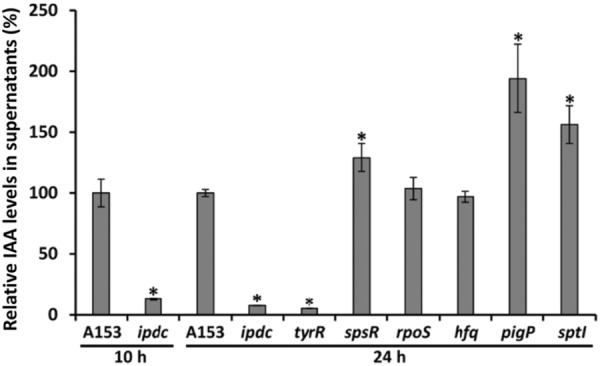
FIGURE 2.

Quantification of indole‐3‐acetic acid (IAA) production by Serratia plymuthica A153 strains measured by gas chromatography coupled to mass spectrometry. Shown are the relative IAA levels in supernatants of different A153 strains grown at 30°C for 10 and 24 h in LB supplemented with 1 mg/mL L‐Trp. Means and standard deviations of three biological replicates are shown. *p < 0.01, Student's t‐test of mutant strains with respect to the A153 wild‐type strain.
