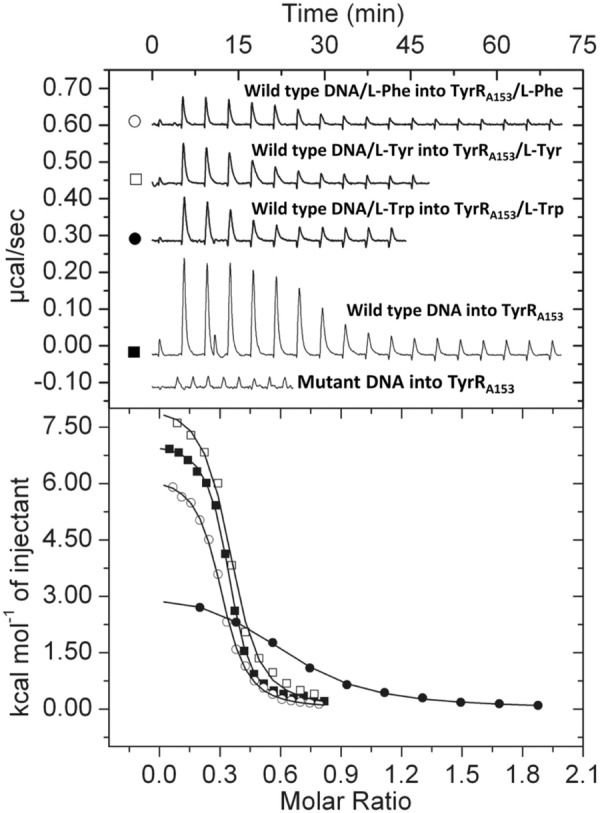
FIGURE 7.

Microcalorimetric titrations of TyrRA153 with 26‐bp DNA oligomers of the ipdc promoter of S. plymuthica A153 containing the wild‐type and mutant TyrR box. Upper panel: Raw data, injection of 3.2–12.8‐μL aliquots of DNA (100 μM) into 5–20 μM TyrRA153 in the presence and absence of saturating concentrations of TyrRA153 ligands. Lower panel: Integrated, dilution heat‐corrected and concentration‐normalized peak areas fitted using the ‘One binding site’ model of the MicroCal version of ORIGIN. Thermodynamic parameters are shown in Table 2. The symbols used in the lower panel are defined in the upper panel of this figure. L‐Tyr, L‐Tyrosine; L‐Phe, L‐Phenylalanine; L‐Trp, L‐Tryptophan.
