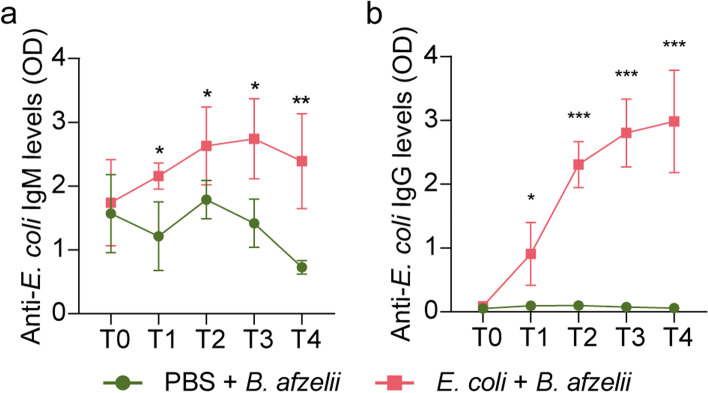
Fig. 3.
Antibody response of mice infected with B. afzelii and vaccinated with live E. coli or mock vaccine. The levels of a IgM and b IgG specific to E. coli proteins were measured by semi-quantitative ELISA in sera of B. afzelii-infected mice immunized with E. coli (pink) and a mock vaccine (green, PBS). Means and standard error values are shown. Results were compared by two-way ANOVA with Bonferroni test applied for comparisons between control and immunized mice. (* p < 0.05, ** p < 0.01; 1 experiment, n = 4 mice per experimental group and three technical replicates per sample)

