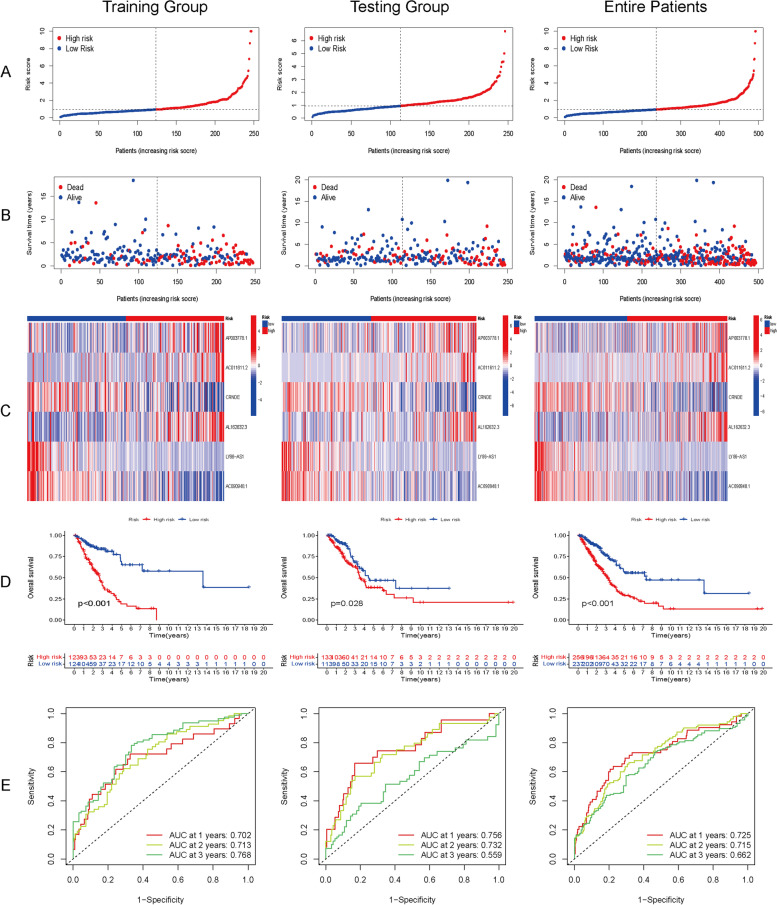
Fig. 3.
Prognostic analysis of the cuproptosis-related lncRNA signature in the training group, testing group and entire patients. A The distribution of the risk scores in the three groups. B The distributions with concomitant risk scores of overall survival status and overall survival in the three groups. C Correlation of the expression of the six cuproptosis-related lncRNAs and risk score in the three groups. D Kaplan–Meier curves for overall survival in the three groups showed that a high risk score indicated poor prognosis. E AUC curve analysis showed the 1-, 2-, and 3-year survival rates in the three groups

