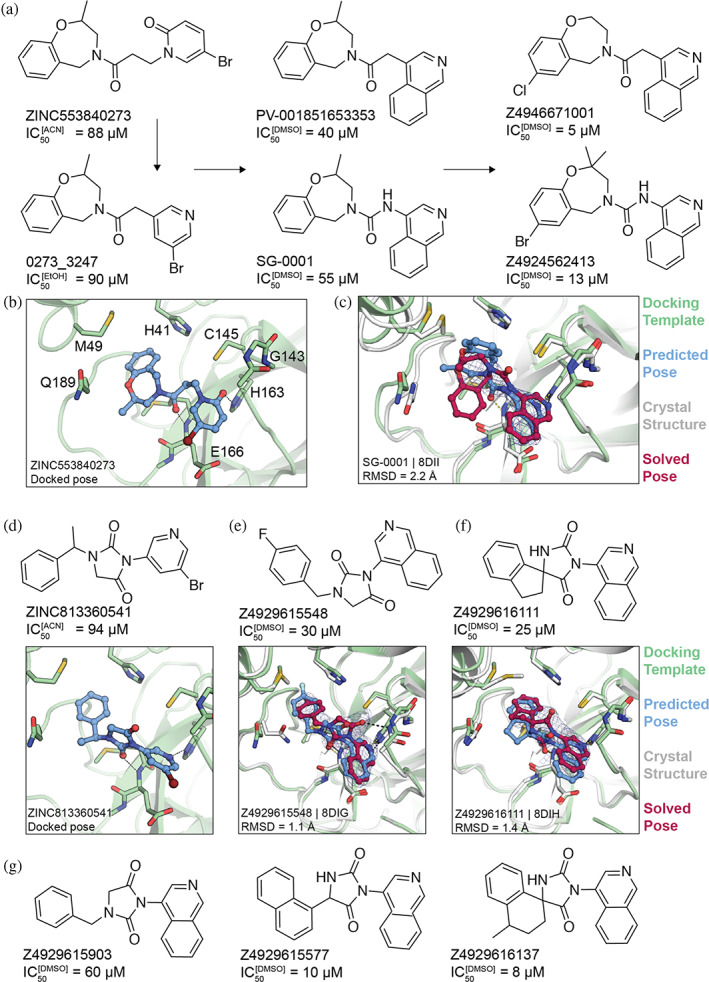
FIGURE 2.

Non‐covalent compound optimization to low‐μM potencies. (a) Progression of the ‘0273 scaffold. (b) Predicted binding pose of ‘0273. (c) Comparison of crystal structure (grey protein, red compound) and docked complex (green protein, blue compound) of SG‐0001 (PDB 8DII). (d) Predicted binding pose of ‘0541. (e), (f) Comparison of crystal structures and docked complexes of ‘5548 (PDB 8DIG) and ‘6111 (PDB 8DIH), respectively. (g) Additional ‘0541 analogs with improved affinities. The 2fo‐fc ligand density maps (blue contour) are shown at 1 σ. Hungarian root mean square deviations (RMSD) were calculated with DOCK6.
