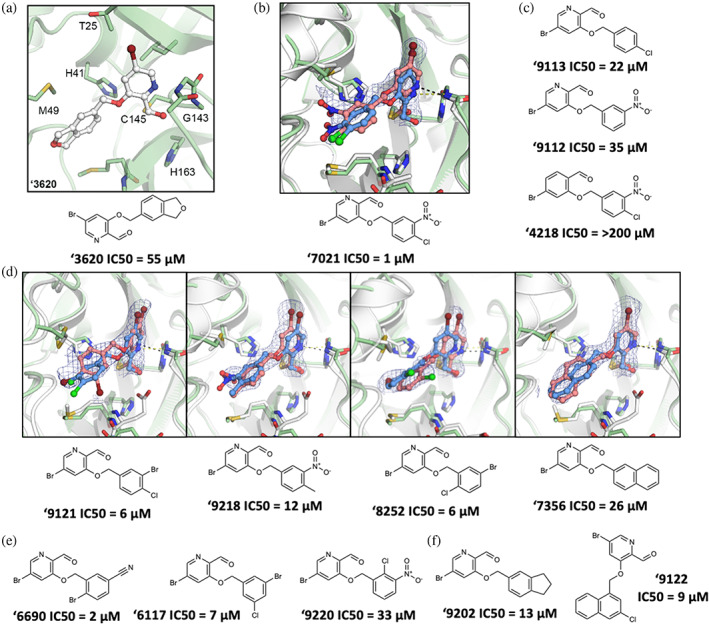
FIGURE 4.

Compound optimization of aldehyde ‘3620. (a) Docked pose of docking hit ‘3620. (b) Crystal structure (pink carbons) and docked pose (blue carbons) comparison for analog ‘7021 (RMSD 1.29 Å; PDB 8DIB). (c) Hypothesis testing analogs of ‘7021 included removing the nitro in ‘9113 and the chlorine in ‘9112, both with weaker inhibition. Analog ‘4218 replaced the pyridine with a benzene eliminating inhibition. (d) Crystal structures of additional ‘3620 analogs comparing experimental (pink carbons) and docked (blue carbons) poses (RMSDs of 1.75, 0.78, 1.18, and 0.84 Å, respectively; PDB 8DIC, 8DIE, 8DID, 8DIF, respectively). (e) Analogs with different benzene substituent orientations (‘6690, ‘6117) inhibit MPro at similar potencies. Substituents oriented like ‘9220 were weaker inhibitors. (f) Examples of the most potent larger hydrophobic analogs of ‘3620. For A‐F, MPro protein structure is PDB 6Y2G (green carbons) used in docking or from the solved structures (white carbons). Hydrogen bonds shown with dashed lines. The 2fo‐fc ligand density maps (blue contour) are shown at 1 σ. IC50 values are shown with concentration response curves in Figure S7. All measurements were done in triplicate.
