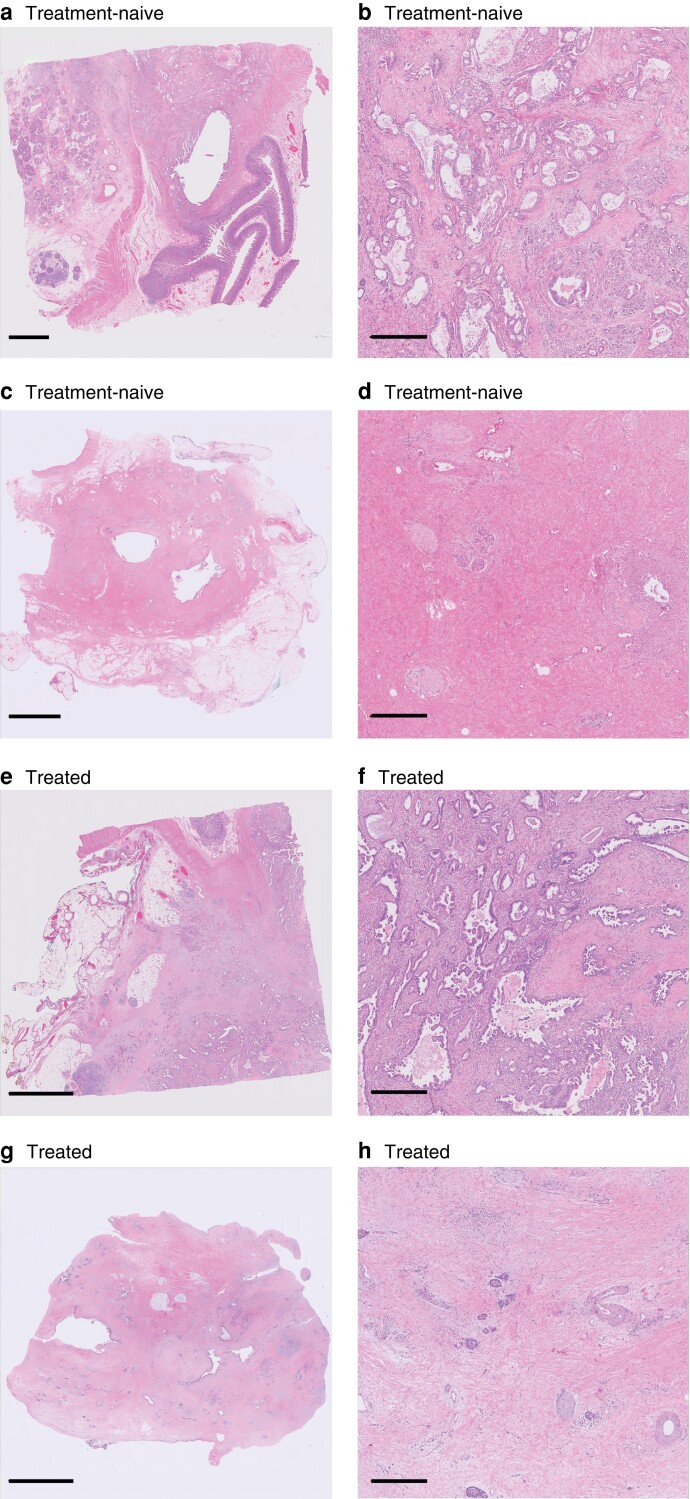
Fig. 2.
Overlap of histomorphological features between treatment-naive and treated patients
a,c Whole-slide images (WSIs) from treatment-naive patients; b,d close-up images of sections in these WSIs. a,b Most pathologists (16 of 18) correctly scored this patient as treatment-naive. c,d Only 2 of 18 pathologists correctly scored this patient as treatment-naive. e,g WSIs from treated patients; f,h close-up images of sections in these WSIs. e,f Only 5 of 18 pathologists correctly scored this patient as treated. g,h All pathologists (18 of 18) correctly scored this patient as treated. Scale bars 5 mm (a,c,e,g) and 0.5 mm (b,d,f,h). All WSIs were scanned at 40× magnification. Sections were stained with haemotoxylin and eosin.

