
Figure 1. DR5 induction by CDKIs in CRC cells with different p53 status.
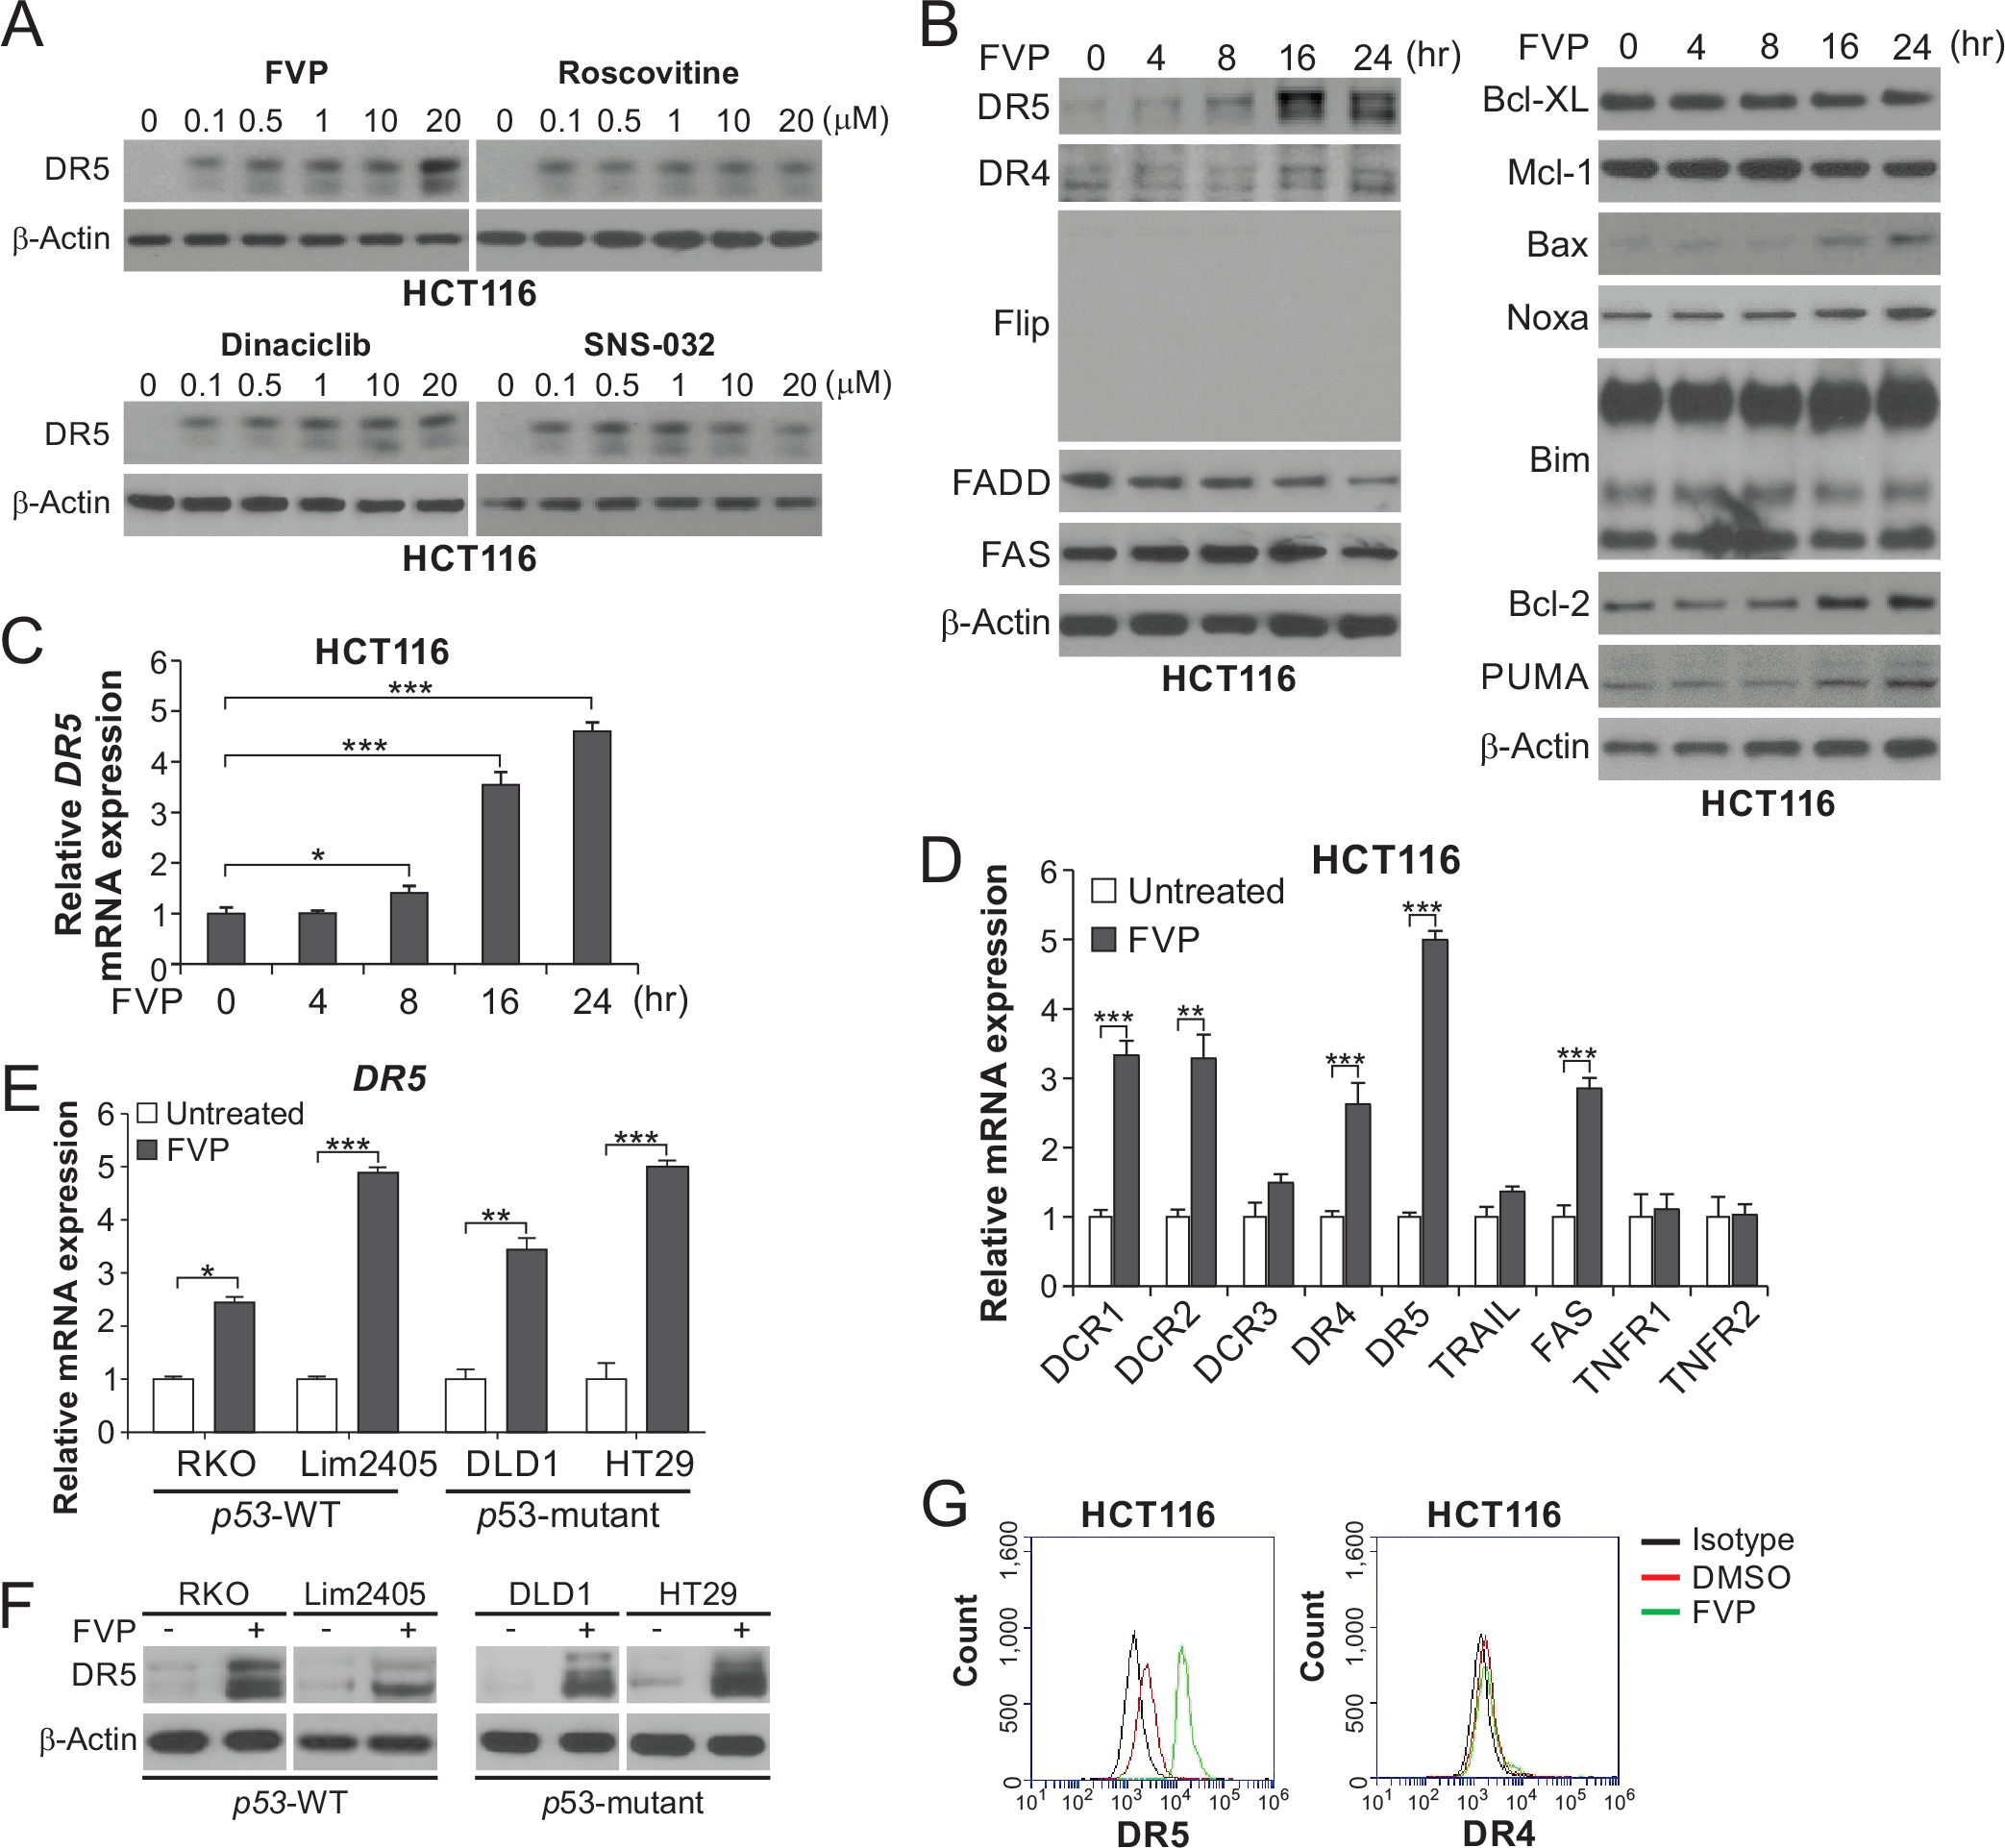
(A) Western blotting of DR5 in HCT116 cells treated with indicated CDKIs at indicated concentrations for 24 hours. (B) Western blotting of indicated proteins in HCT116 cells treated with 50 nM flavopiridol (FVP) at indicated time points. (C) Time course of DR5 mRNA induction in HCT116 cells treated with 50 nM FVP was analyzed by real-time reverse transcriptase (RT)-PCR. (D) HCT116 cells treated with 50 nM FVP for 24 hours were analyzed for mRNA expression of the indicated genes by real-time RT-PCR. (E), (F) DR5 expression in CRC cell lines with different p53 status and treated with 50 nM FVP for 24 hours was analyzed by (E) real-time RT-PCR and (F) Western blotting. (G) HCT116 cells treated with FVP as in (D) were analyzed for cell-surface DR5 and DR4 by flow cytometry. In (C)-(E), values were expressed as means ± SD of three independent experiments. *, P < 0.05; **, P < 0.01; ***, P < 0.001.