
Figure 3. Knockdown of CDK1, 2, or 9 recapitulates p73-mediated DR5 induction.
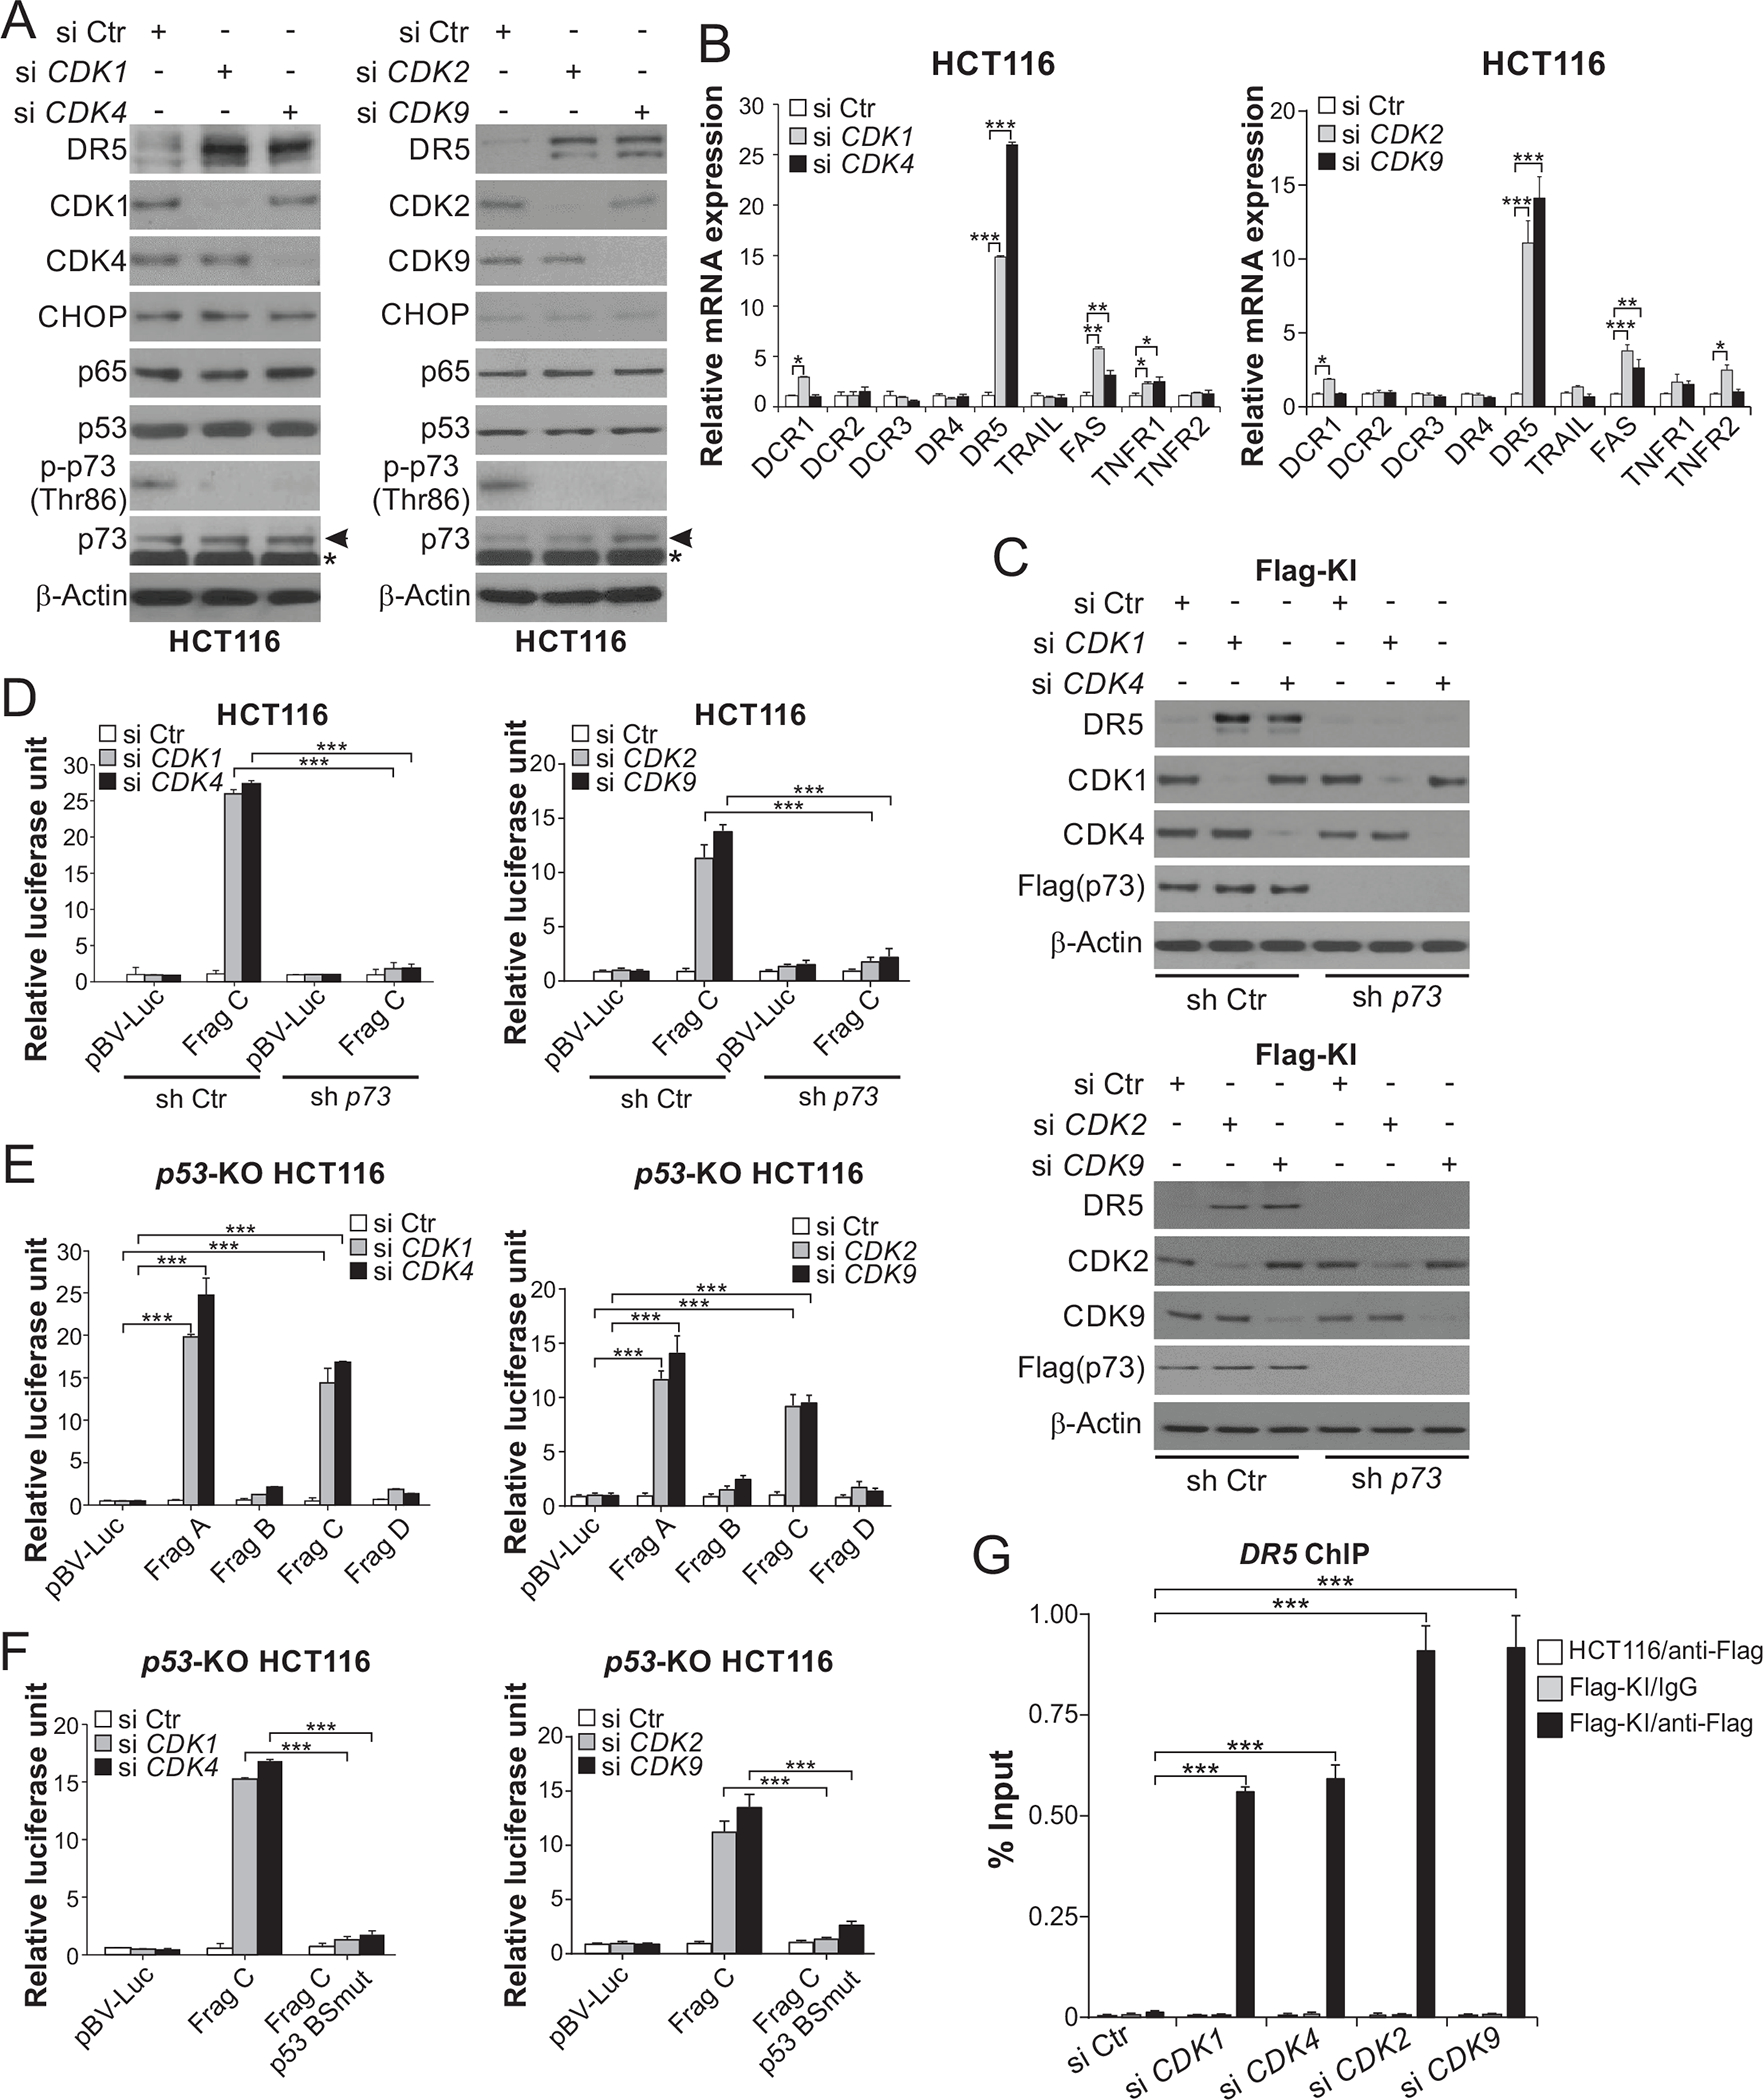
(A), (B) HCT116 cells transfected with control scrambled (Ctr), CDK1, 2, 4, or 9 siRNA for 24 hours. (A) Western blotting of indicated proteins. Arrows indicate p73 and stars indicate nonspecific bands. (B) Real-time RT-PCR analysis of mRNA expression of indicated apoptosis regulators. The results were normalized to cells transfected with si Ctr. (C) Western blotting of indicated proteins in stable p73 KD (sh p73) and control (sh Ctr) Flag-KI HCT116 cells transfected with indicated siRNA for 24 hours. (D)-(F) Sh p73, sh Ctr, or p53-KO HCT116 cells were transfected with the indicated DR5 promoter reporters along with indicated siRNA for 24 hours. Reporter activities were measured and normalized to the untreated control samples. In (D) and (E), reporters contain different regions of the DR5 promoter (Frag A-D). The p53 binding site is present in Frag A and Frag C (Fig. S2F). In (F), reporters contain Frag C with WT or mutant p53 binding site (p53 BSmut) (Fig. S2F). (G) Parental and Flag-KI HCT116 cells were transfected with indicated siRNA for 24 hours. The binding of Flag-tagged p73 to the DR5 promoter was analyzed by ChIP as in Fig. 2H. In (B) and (D)-(G), values were expressed as means ± SD of three independent experiments. *, P < 0.05; **, P < 0.01; ***, P < 0.001.