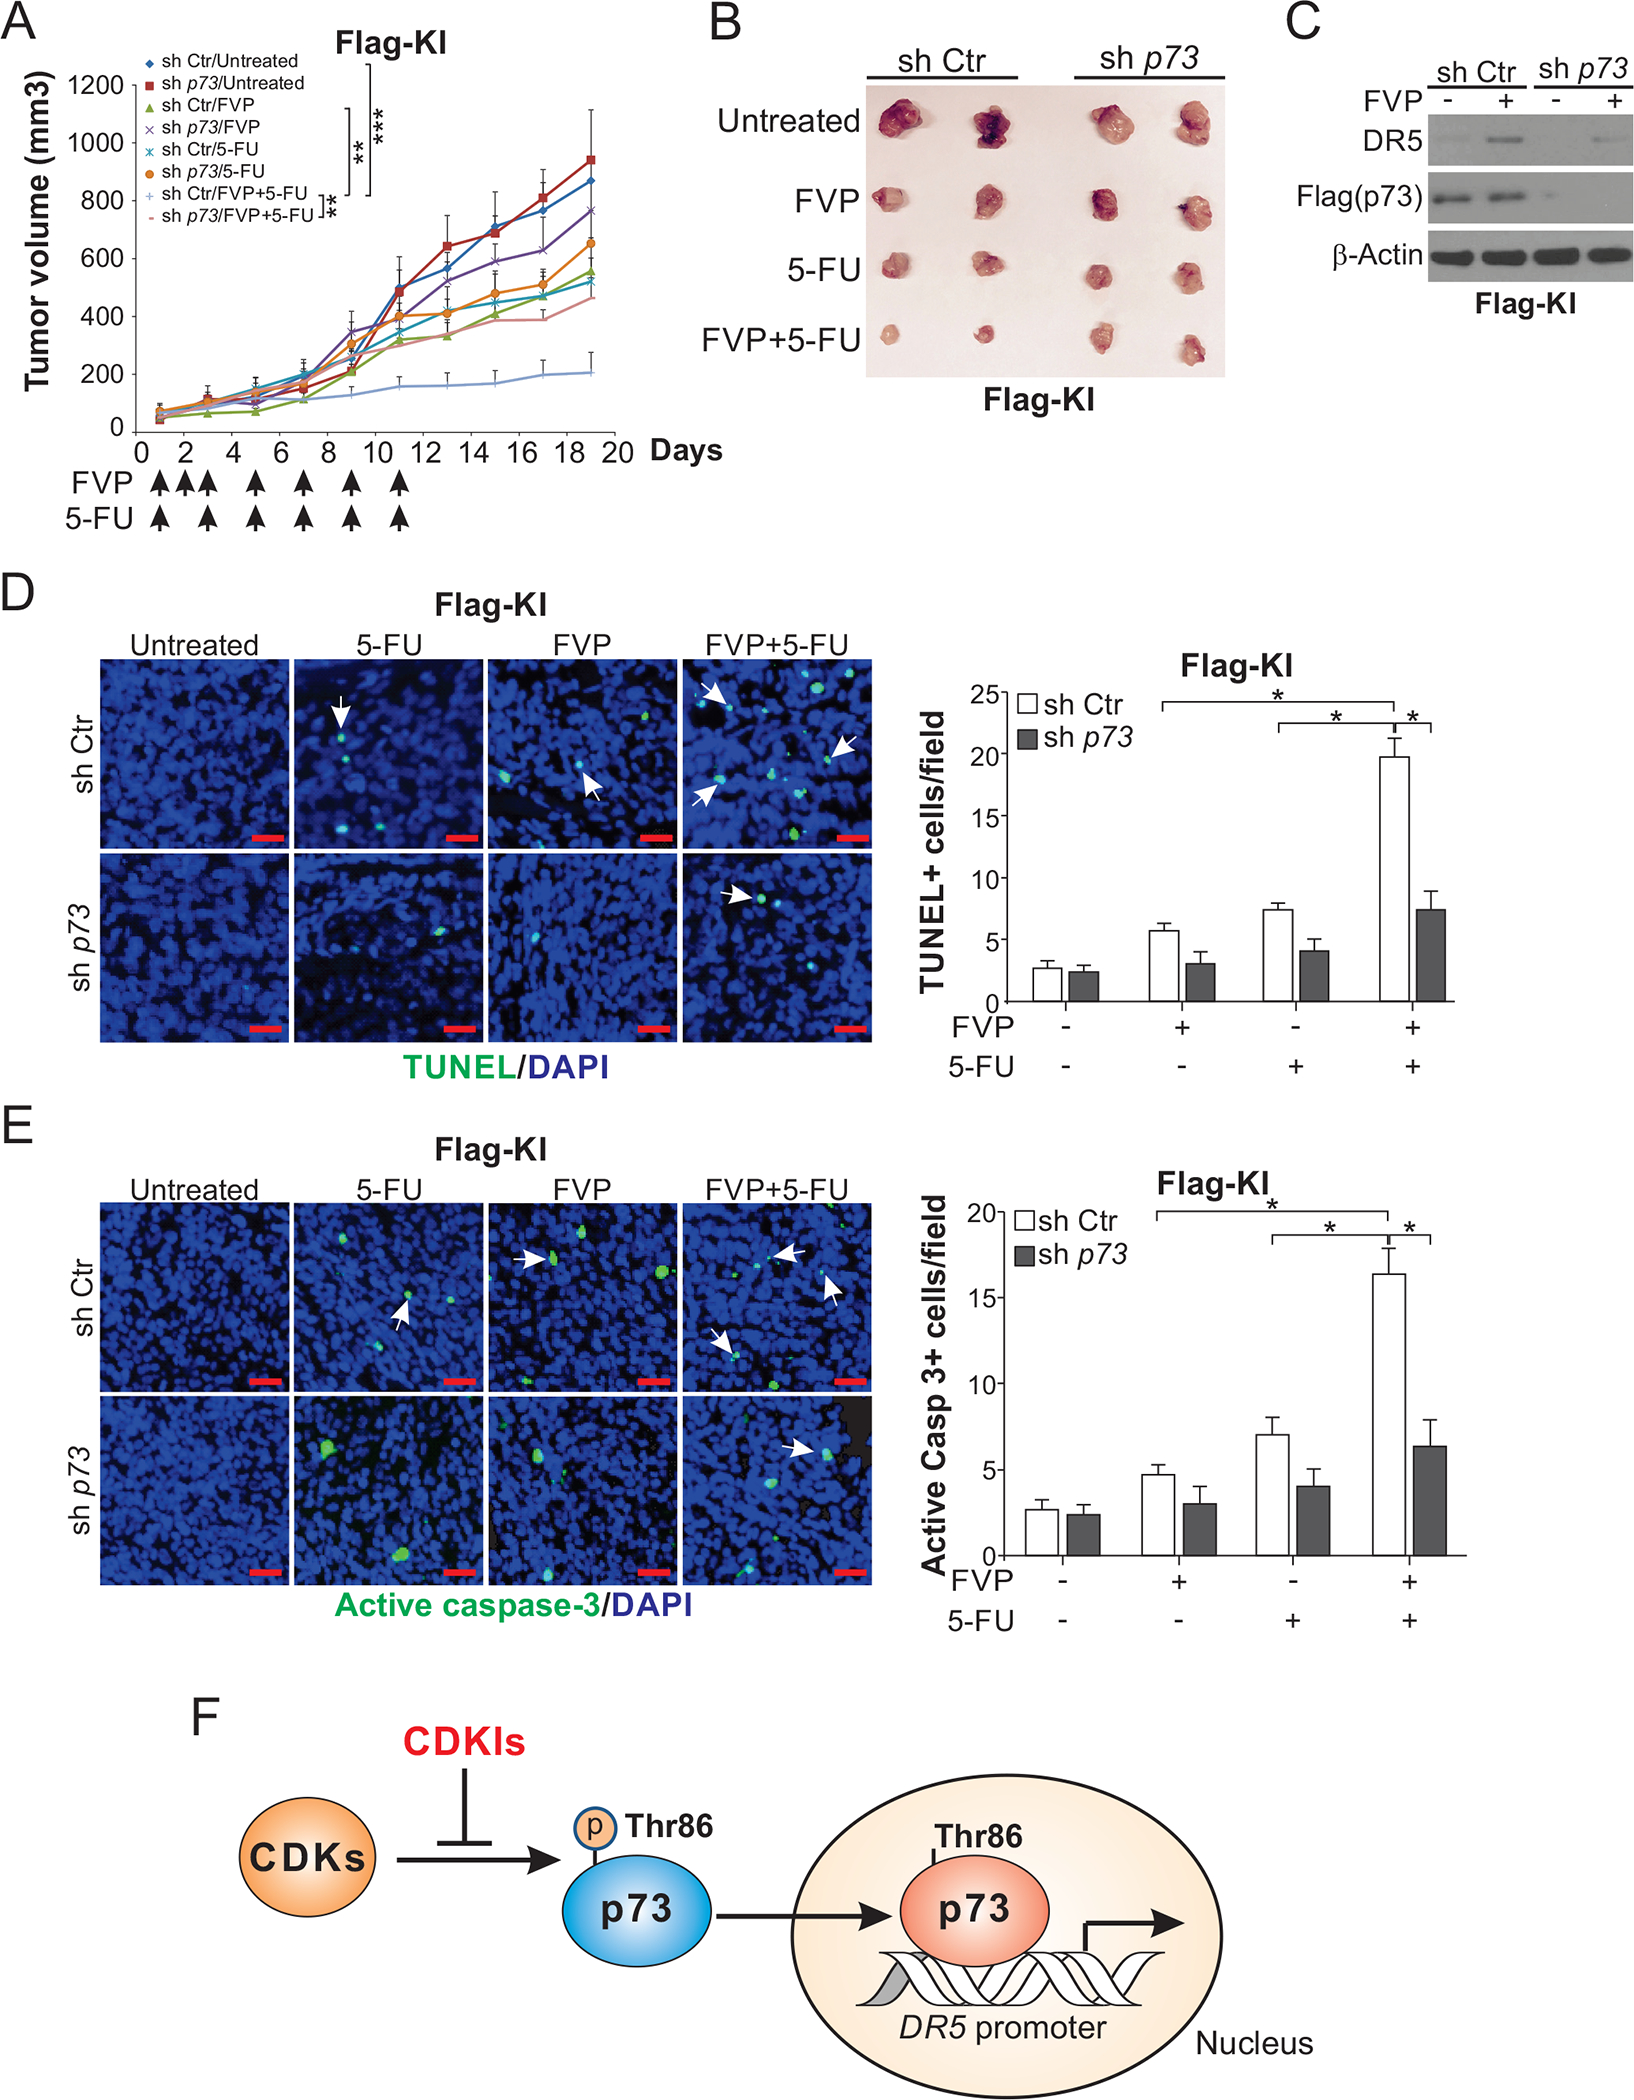
Figure 7. p73 is required for DR5 induction and the in vivo antitumor effects of the FVP/5-FU combination.

(A) Nude mice were injected s.c. with 4×10⁶ sh p73 or sh Ctr Flag-KI HCT116 cells. After tumor growth for 7 days, mice were treated with FVP (i.p.; 5 mg/kg every day for 3 days and then every other day), 5-FU (i.p.; 25 mg/kg every other day), or their combination as indicated for 11 days. Tumor volume at indicated time points after treatment was calculated and plotted with p values for indicated comparisons (n=6 in each group; **, P < 0.01; ***, P < 0.001). (B) Representative tumors at the end of the experiment in (A). (C)-(E) Mice with sh p73 or sh Ctr Flag-KI HCT116 xenograft tumors were treated as in (A) for 4 consecutive days. (C) Western blotting of DR5 in randomly selected WT tumors. Apoptosis was analyzed by (D) TUNEL and (E) active caspase 3 staining of paraffin-embedded sections of sh Ctr and sh p73 tumor tissues. Left, representative staining pictures with arrows indicating example positive signals (scale bar: 25 μm); right, quantification of positive signals. (F) Schematic diagram of a model depicting p73-mediated DR5 induction by CDKIs. In (D) and (E), values were expressed as means ± SD of 3 independent experiments. *, P < 0.05.
