
Figure 2.
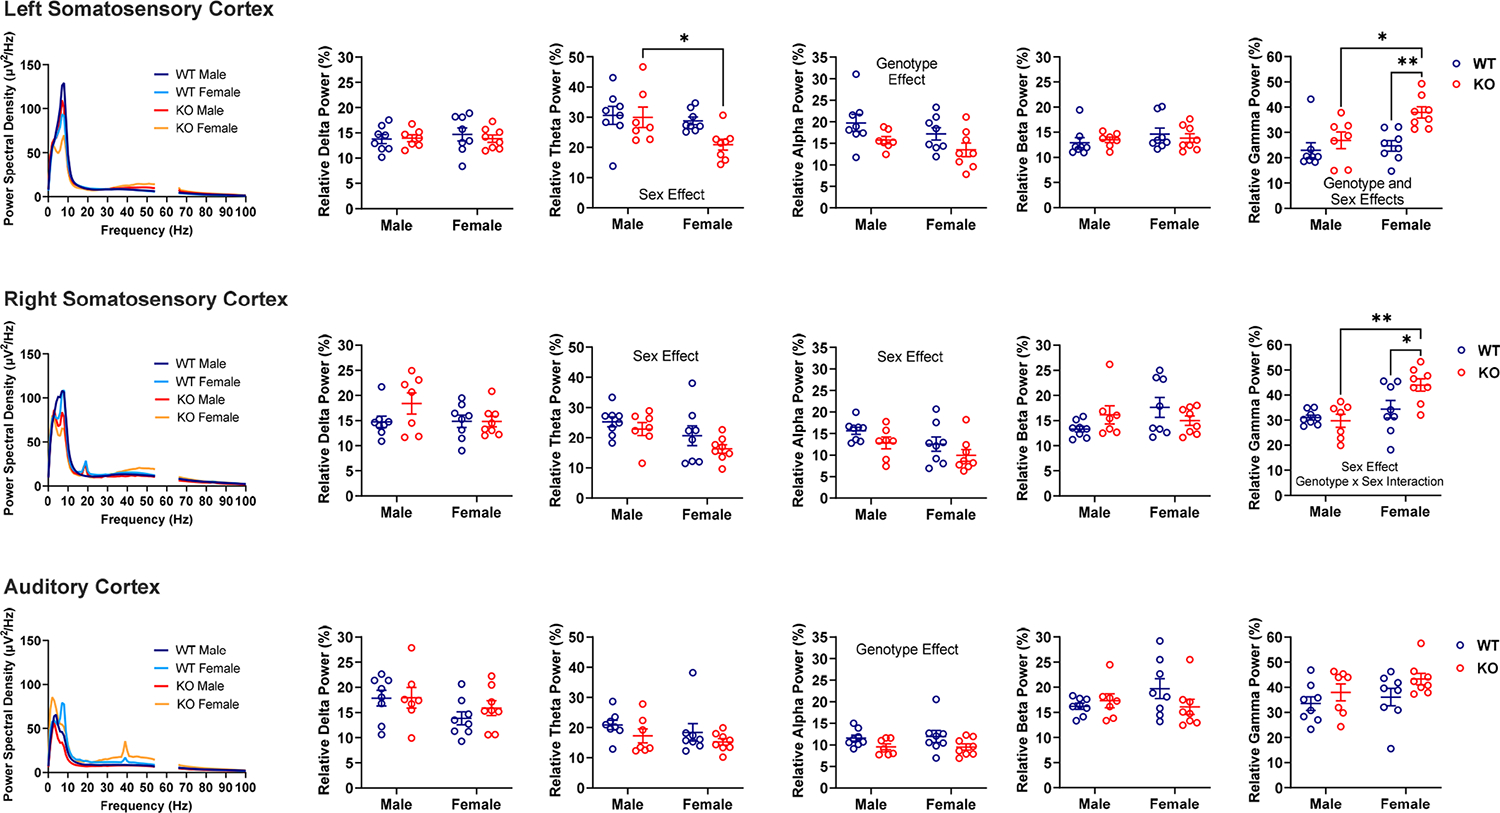
Effects of genotype and sex on relative EEG power in male and female WT and Fmr1 KO mice at baseline. Power spectral density (leftmost column) shows absolute power per frequency. Scatter dot plots show relative power. Significant (P < 0.05) main effects are written on the graphs. Note there were region-dependent genotype effects on relative alpha (Fmr1 KO < WT) and gamma (Fmr1 KO > WT) power, and there were region-dependent sex effects on relative theta (female < male), alpha (female < male), and gamma (female > male) power. There was also a genotype-by-sex interaction on relative gamma power (higher power observed in female Fmr1 KO). Data were analyzed by two-way ANOVA. *P < 0.05, **P < 0.01 show significant results from Šídák’s multiple comparisons tests.