
FIGURE 3.
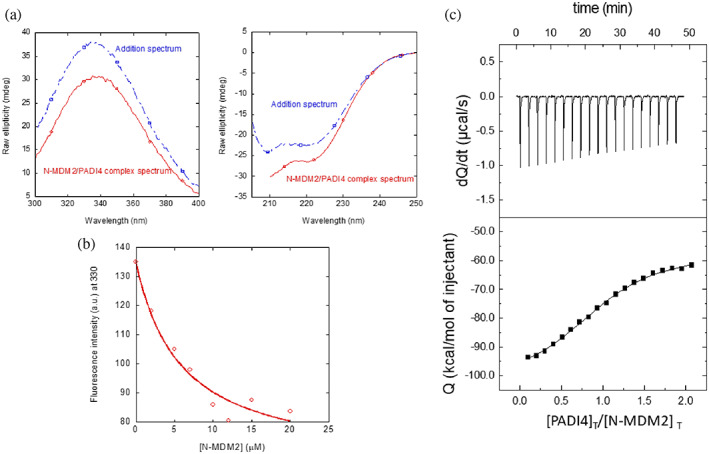
Binding of N‐MDM2 to PADI4 as monitored by different biophysical probes: (a) (Right panel) Fluorescence spectrum obtained by excitation at 280 nm of the N‐MDM2/PADI4 complex, and addition spectrum obtained by the sum of the spectra of the two isolated macromolecules. (Left panel) Far‐UV CD spectrum of the N‐MDM2/PADI4 complex, and addition spectrum obtained by the sum of the spectra of the two isolated macromolecules. (b) Titration curve monitoring the changes in the fluorescence at 315 nm when N‐MDM2 was added to PADI4. The fluorescence intensity on the y‐axis is the relative signal after removal of the corresponding blank. The line through the data are the fitting to Equation (1). Experiments were carried out at 25°C. (c) Calorimetric titrations for the PADI4 binding to N‐MDM2. Upper panel show the thermogram (thermal power as a function of time), and lower panel show the binding isotherm (ligand‐normalized heat effects per injection as a function of the molar ratio in the calorimetric cell). Continuous lines correspond to the fitting curves according to a single ligand binding site interaction model. Experiments were carried out at 25°C.