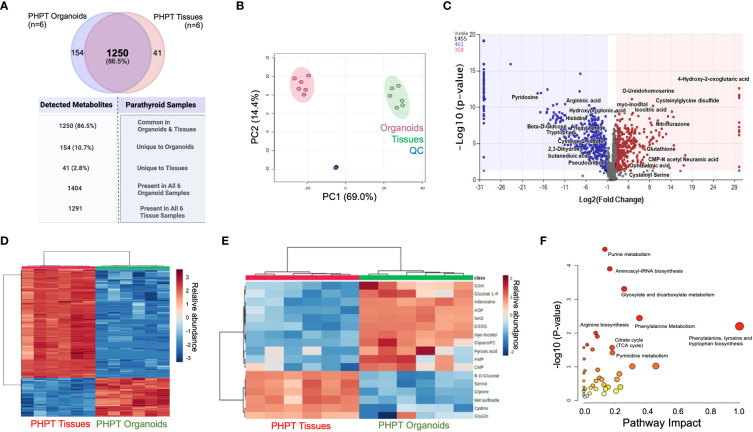
Figure 2.
Metabolomic Analysis of Parathyroid PDOs and PHPT tissues. (A) The Venn diagram depicts the total metabolites detected and specimen-specific unique metabolites detected. (B) The principal component analysis (PCA) of significant metabolites identified in parathyroid PDOs and tissues. Red circles denote organoids, greens circles are tissues, whereas blue circles are quality control (QC) samples (equal composition of both organoids and tissue samples). (C) Volcano Plot showing the distribution of metabolic compounds for pairwise comparison based on significance criteria for p-value and fold change. P-values are based on mean difference and variance across the number of sample replicates and are generated using ANOVA. The total number of compounds that met significant criteria for group comparison are colored blue (negative fold change) or red (positive fold change), above the dashed line representing p ≤ 0.05. (D) Heat map clustering of the experimental sample groups and compounds. Samples (columns) are clustered by group, and relative feature abundance (rows) across different groups, ranging from low (blue) to high (red) abundance. The heat map was generated for Pareto-scaled, log transformed data using Pearson distance and Average clustering via Metaboanalyst5.0. (E) Heat Map clustering of the experimental sample groups and compounds for the most representative compounds for the parathyroid function. Samples (columns) are clustered by group, and relative feature abundance (rows) across different groups, ranging from low (blue) to high (red) abundance. The heat map was generated for Pareto-scaled, log transformed data using Pearson distance and Average clustering via Metaboanalyst 5.0. (F) KEGG pathway analysis of annotated metabolites. Analysis using the annotated list of 820 compounds (p ≤ 0.05, fold change ≥ │2│) from parathyroid PDO vs. PHPT tissues. Pathways are mapped by p-values (from pathway enrichment analysis) on the Y-axis, and pathway impact values (from pathway topology analysis) on the X-axis. The node color is based on pathway p-value and the node radius is determined based on pathway impact values.

