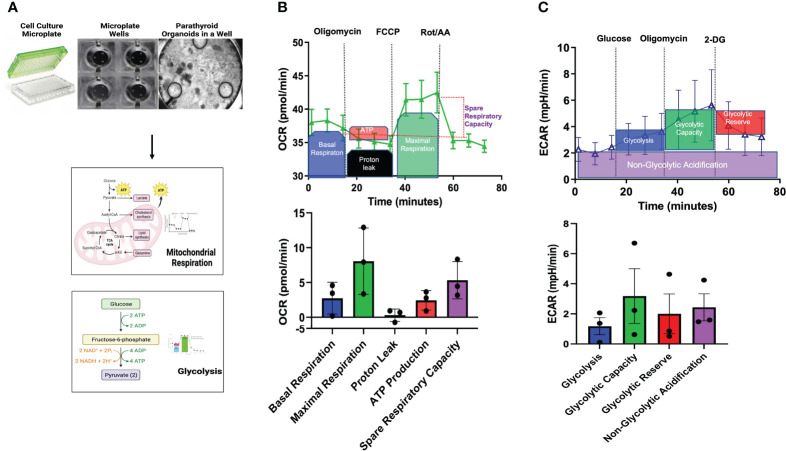
Figure 4.
Bioenergetic Flux Analyses. (A) Seahorse Agilent culture microplates, an empty well, and a well plated with parathyroid PDOs is imaged by brightfield microscopy to undergo mitochondrial respiration and glycolysis pathway analyses. (B) Mitochondrial stress flux analysis results of parathyroid PDOs. Top graph showing the treatment of organoids with modulators of mitochondrial respiration at various time points and description of results. Oxygen consumption rate (OCR) will be measured before and after inhibitor treatment. Bottom bar graph shows the mitochondrial respiration parameters: basal respiration, maximal respiration, proton leak, ATP production, and spare respiratory capacity of parathyroid PDOs. (C) Top graph shows extracellular acidification rate (ECAR) after glycolysis stress of parathyroid PDOs. Bottom bar graph shows parameters of glycolysis, glycolytic capacity, glycolytic reserve, and non-glycolytic acidification of parathyroid PDOs.

