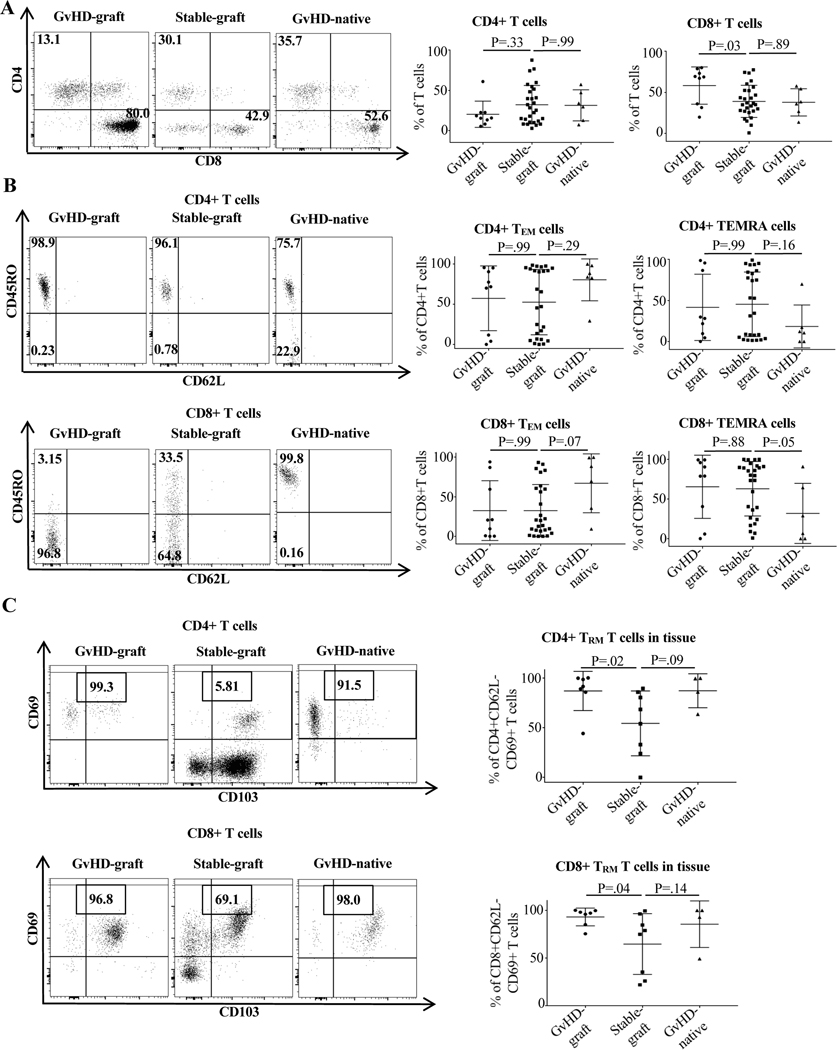
Figure 4. T cell phenotype in graft and native intestine in GvHD and control patients.
All samples were collected and analyzed as described in Materials and Methods and Supporting Materials and Methods. GvHD graft samples were taken from biopsies at the time of GvHD episodes. Control graft samples were taken at protocol biopsy timepoints in patients who never experienced GvHD or rejection. GvHD native bowel samples were taken from biopsies at the time of GvHD episodes. (A) Overall differences in CD4 and CD8 expression showing increased CD8 expression in graft bowel at the time of GvHD. (B) Comparison of CD4+ and CD8+TEM and TEMRA expression showing numerically large significantly decreased+ CD8 TEMRA percentage and nearly significantly increased CD8+TEM percentage in native gut (the tissue target in in GvHD) at the time of GvHD. (C) Comparison of TRM expression between groups showing numerically large and significantly increased percentage of CD4+ and CD8+TRM in graft bowel and numerically large and nearly significant increased percentage of CD4+ and CD8+TRM in native bowel at the time of GvHD. Non-parametric Mann-Whitney test was used. For more than two independent groups, the Kruskal-Wallis test was performed followed with Dunn’s multiple comparisons.

