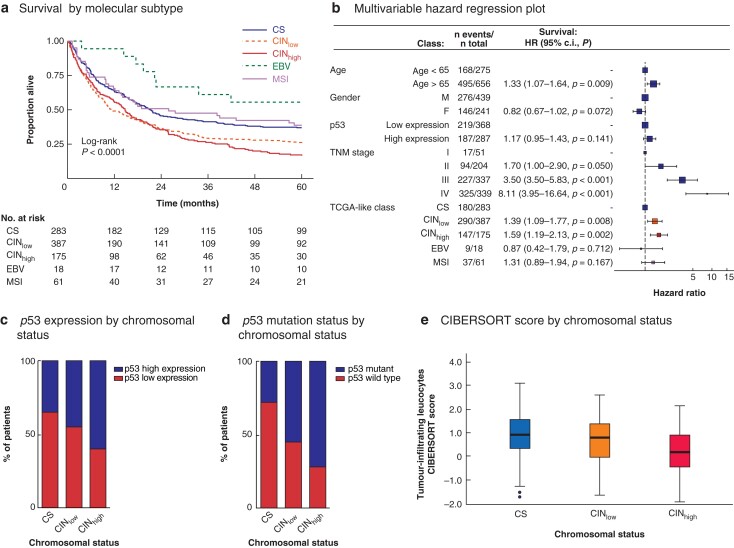
Fig. 2.
Survival by Cancer Genome Atlas-like classification in univariable and multivariable analyses, and association of chromosomal status with p53 expression, p53 mutation, and tumour immune cell infiltration
a Kaplan–Meier analysis of 5-year overall survival of patients with resectable gastric cancer by molecular subtype. CS, chromosome-stable; CINlow, chromosomal instability low; CINhigh, chromosomal instability high; EBV, Epstein–Bar virus; MSI, microsatellite instability. b Multivariable hazard regression plot; hazard ratios are shown with 95 per cent confidence intervals. c Stacked bar chart showing p53 expression level (high versus low) in relation to chromosomal status in test and validation cohorts combined (P < 0.001, Pearsons' Chi Squared test). d Stacked bar chart showing p53 mutation status in relation to chromosomal status in TGCA-STAD patients (P < 0.001, Pearsons' Chi Squared test). e Box plot showing CIBERSORT-derived lymphocyte infiltration signature score in TCGA-STAD patients according to chromosomal status. Median values (bold line), interquartile range (box), and range (error bars) excluding outliers (symbols) are shown (P < 0.001, Kruskal-Wallis test).

