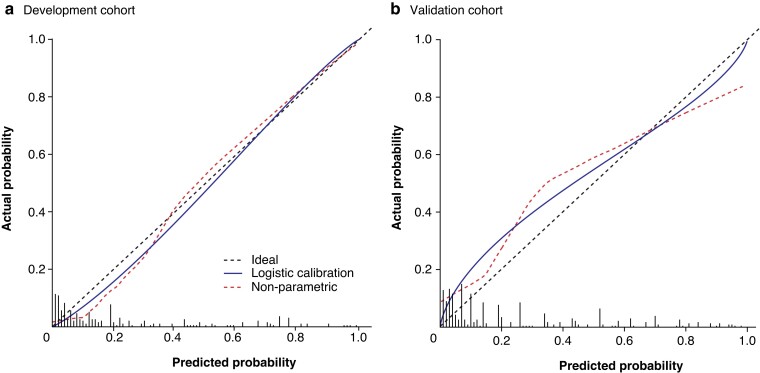
Fig. 3.
Calibration plots for DISPAIR score development and validation cohorts a Development cohort (Helsinki) and b validation cohort (Stockholm). Histograms represent the distribution of predicted risk. a AUROC 0.904, R2 = 0.533, Brier score 0.084, intercept –0.109, slope 1.135; b AUROC 0.798, R2 = 0.253, Brier score 0.162, intercept 0.192, slope 0.719.

