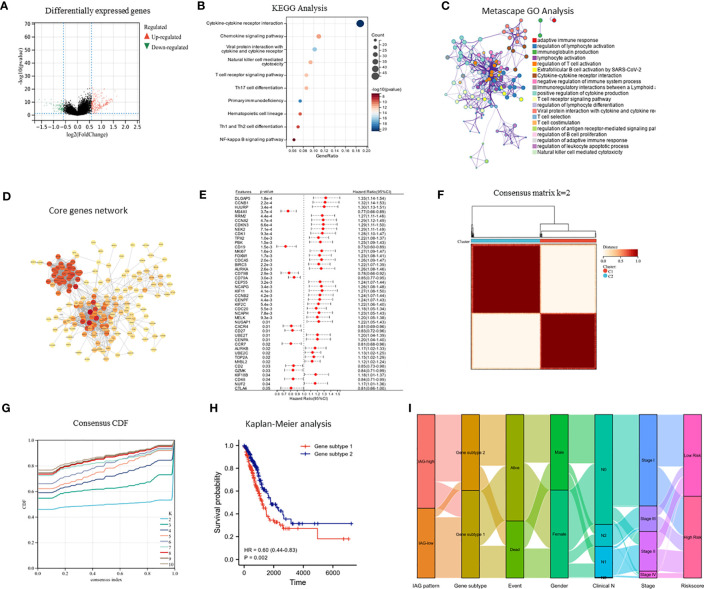
Figure 4.
Identification of immune activation related gene subtypes based on differentially expressed genes. (A) Volcano map showed differentially expressed genes between two patterns (|FC| >1.5, P < 0.05); (B) KEGG enrichment analysis of differentially expressed genes; (C) GO enrichment analysis of differentially expressed genes using Metascape; (D) Construction of core gene network using STRING database and cytoscope software; (E) Univariate cox analysis of core genes; (F, G) Consensus clustering based on core genes; (H) Prognostic differences between two genomic subtypes. (I) Sankey diagram based on IAG patterns, gene subtypes, gender, pathological stage, survival status and risk score.

