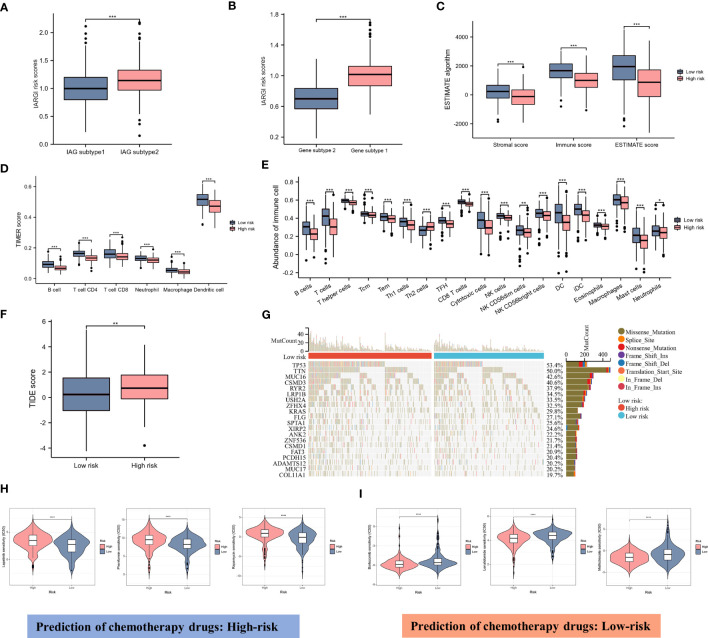
Figure 7.
Correlation between IARGI and TME, mutation levels, chemotherapeutic drug sensitivity. (A) IARGI risk scores in IAG-high and IAG-low patterns; (B) IARGI risk scores in the two different gene subtypes; (C) Stromal score, immune score, and estimate score between high- and low-risk groups; (D) Evaluation of immune cell infiltration in high-risk and low-risk groups by TIMER algorithm; (E) Evaluation of immune cell infiltration in high-risk and low-risk groups by ssGSEA algorithm. (F) TIDE score in high-risk and low-risk groups; (G) Genetic mutation in high-risk and low-risk groups; (H, I) Prediction of chemotherapeutic drugs in high-risk and low-risk groups. *P<0.05, **P<0.01, ***P < 0.001.

