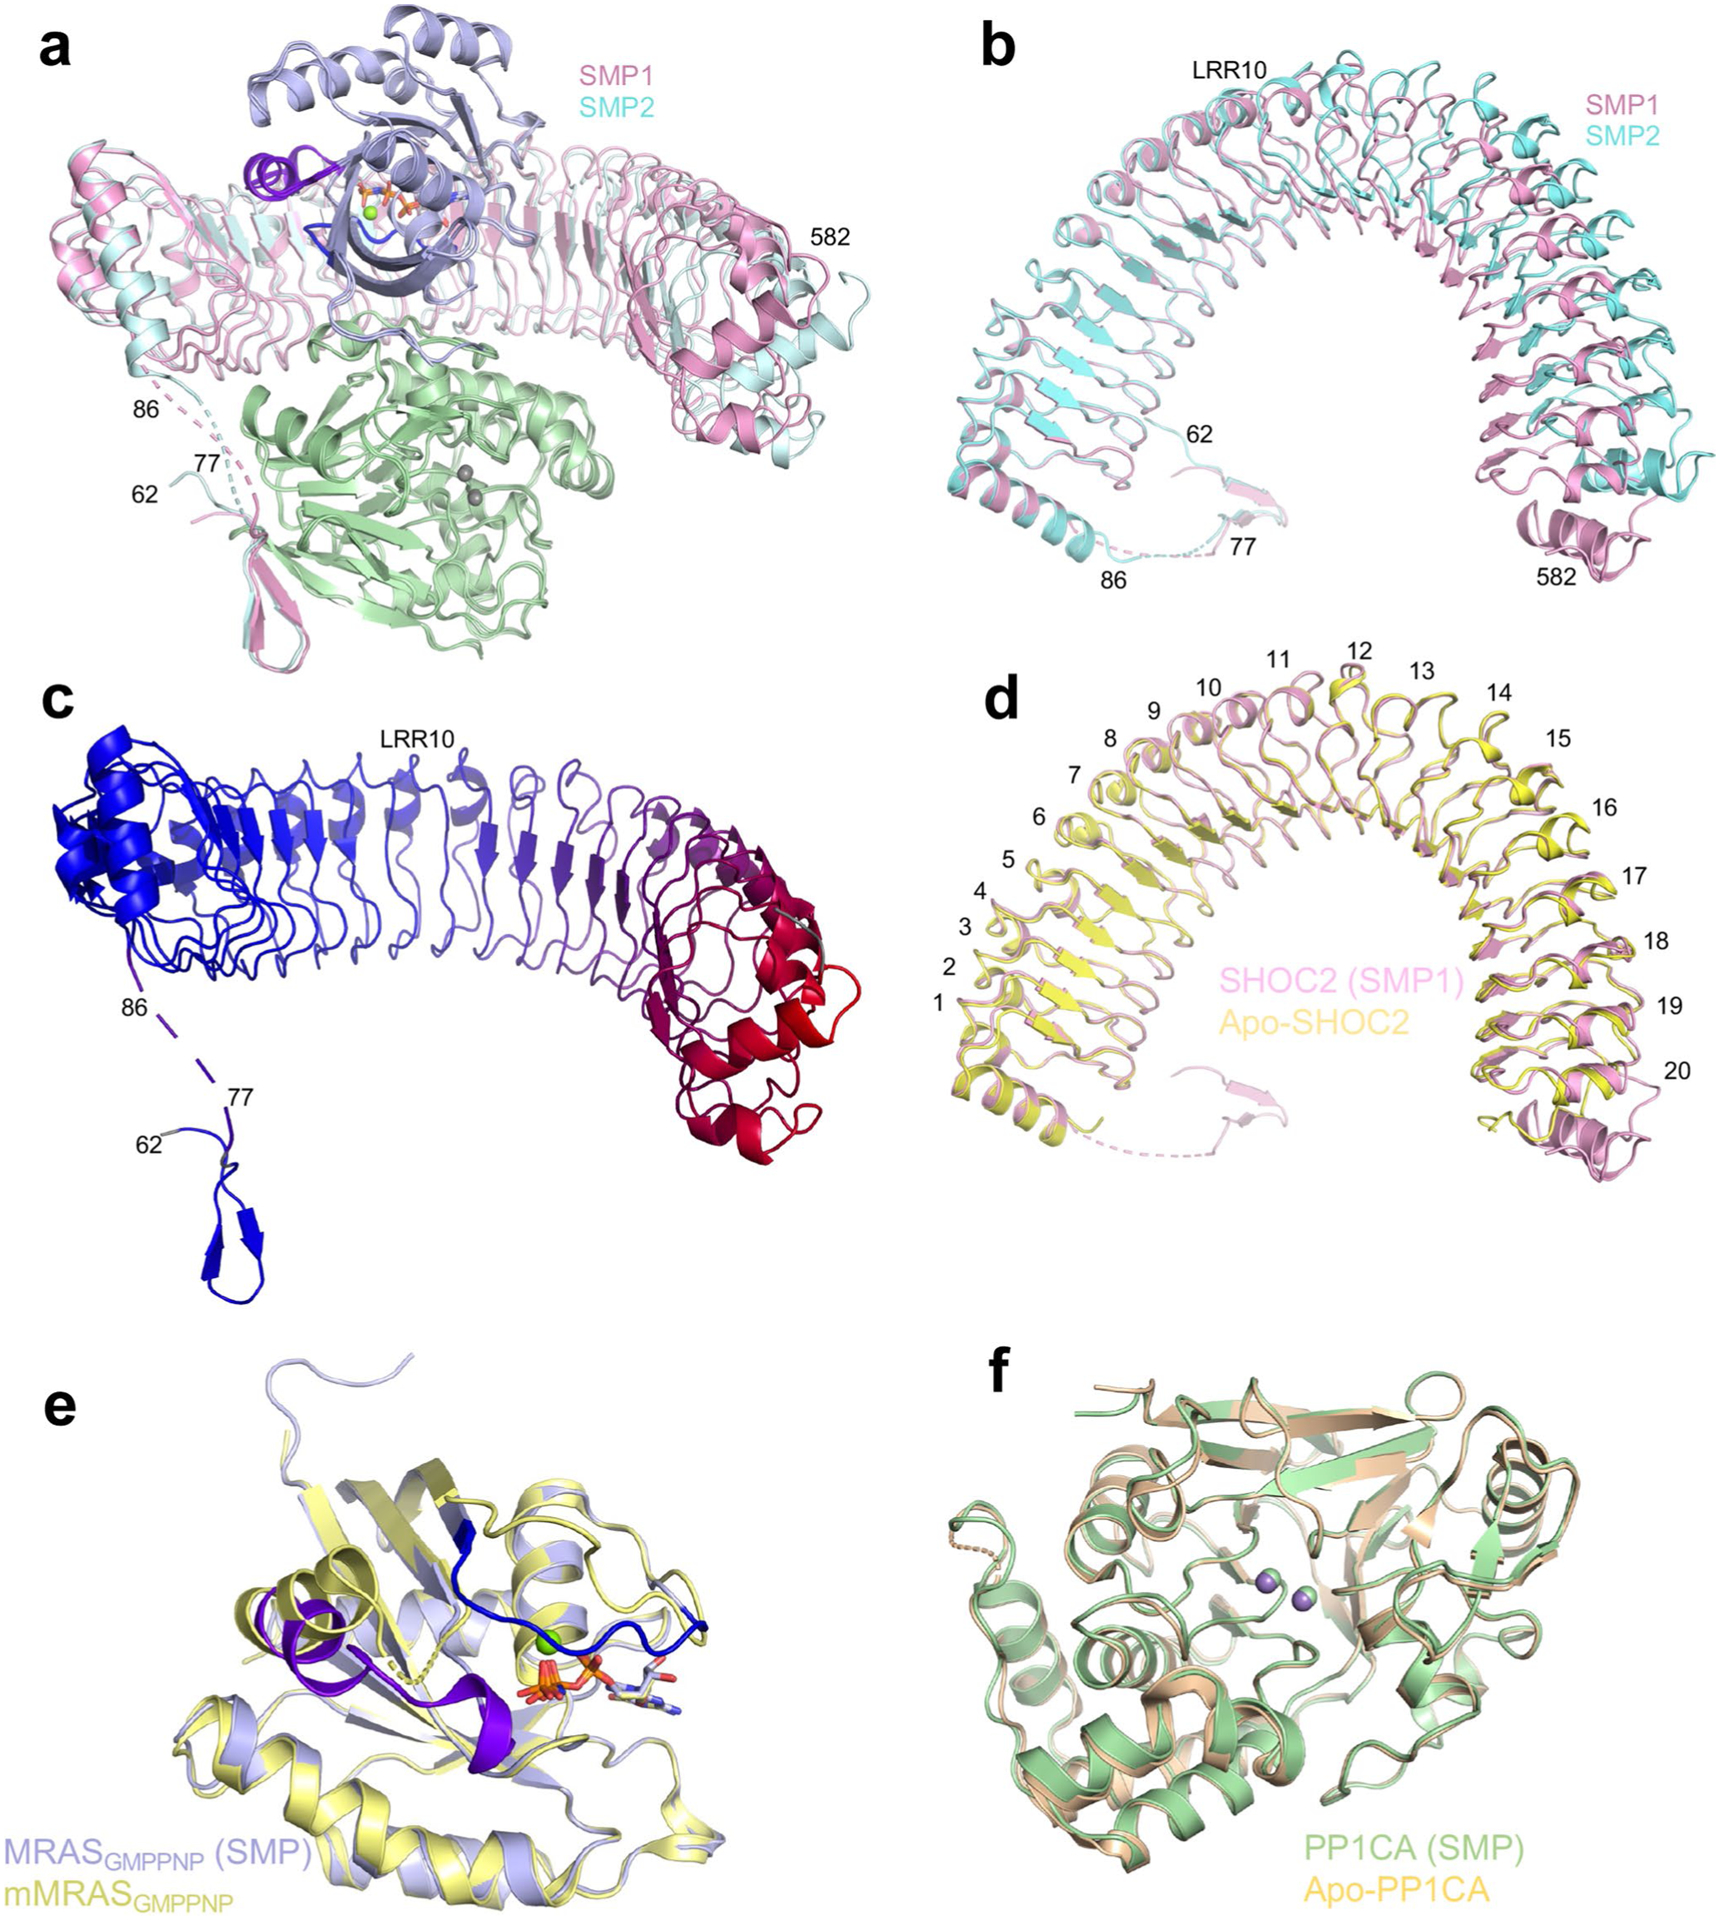
Extended Data Fig. 2 |. Comparison of the individual components of the SMP complex with their apo-forms.

a Superposition of the two SMP complexes found in the asymmetric subunit in cartoon form. Both chains of MRAS and PP1CA are in the same color, while the two SHOC2 chains are colored pink and cyan. The overall, SHOC2, MRAS and PP1CA RMSDs are 0.62 Å, 1.74 Å, 0.19 Å and 0.15 Å, respectively. b Top view as shown in panel a without MRAS and PP1CA present. LRR10 is marked, highlighting the hinge. c A cartoon of SHOC2 with a color gradient from blue to red showing the RMSD between the two SHOC2 molecules in the SMP complex, with blue and red representing low and high RMSD, respectively. LRR10 is marked highlighting the hinge. d Superposition of apo-SHOC2 (yellow) with SHOC2 from the SMP complex (pink) which was used for all subsequent analysis. All LRRs are labeled. e Superposition of mouse MRAS bound to GMPPNP (yellow; PDB ID 1X1S36) with human MRAS from the SMP complex (blue). Switch I, switch II, nucleotide and Mg2+ ions are shown in dark blue, purple, sticks and green spheres, respectively. The overall RMSD is 0.32 Å. f Superposition of apo-PP1CA (olive, PDB ID 4MOV37) with PP1CA from the SMP complex (green). Mn2+ ions from SMP and apo-PP1CA are shown in green and gray, respectively. The overall RMSD is 0.28 Å.
