
FIGURE 3.
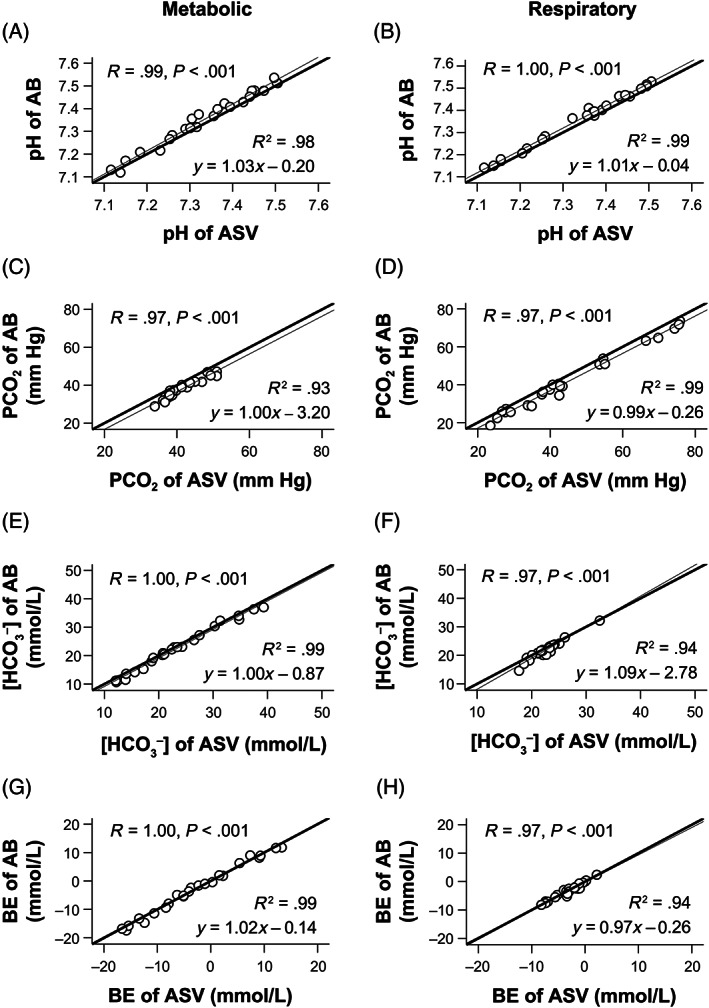
The linear regression analyses demonstrate that the pH (A,B), PCO2 (C,D), [HCO3 −] (E,F), and BE (G,H) values of the AB and ASV samples were very strongly correlated and are almost identical under both metabolic (A,C,E,G) and respiratory (B,D,F,H) acid‐base disorders in all eight dogs. The thick lines indicate that the two measurements of the AB and ASV samples are identical. The thin lines are regression lines. AB, arterial blood; ASV, arterialized saphenous venous blood; BE, base excess; PCO2, partial pressure of carbon dioxide; R, correlation coefficient; R 2, coefficient of determination; [HCO3 −], bicarbonate concentration.