
FIGURE 4.
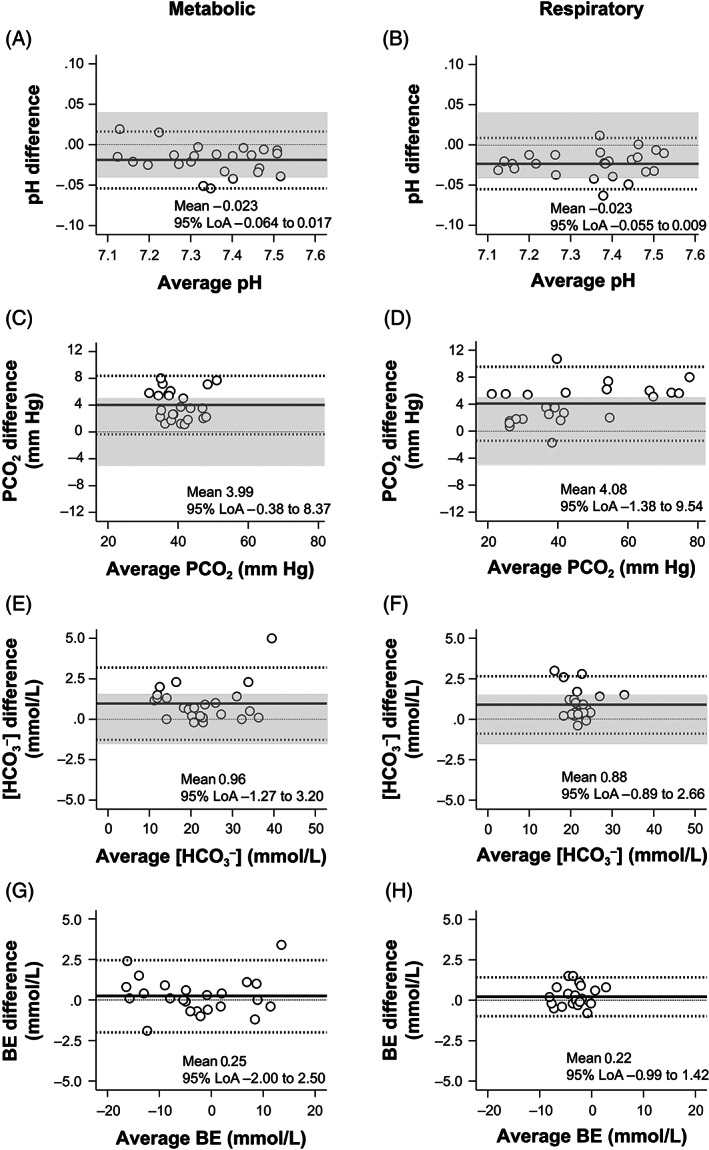
The Bland‐Altman plots for pH (A,B), PCO2 (C,D), [HCO3 −] (E,F), and BE (G,H) values show differences between the two measurements of the AB and ACV samples against their average under metabolic (A,C,E,G) and respiratory (B,D,F,H) acid‐base disorders. The central solid line represents the mean bias of measurements; the adjacent broken lines show the 95% LoA (±1.96 SD); and the thin dashed line is the best fit. The clinically allowable limits defined in the present study are shaded gray. The pH, [HCO3 −], and BE values of the ACV samples showed good clinical agreement with those of the AB samples. The PCO2 values of the ACV overestimated those of the AB (mean bias of 3.99 and 4.08 mm Hg, respectively) under metabolic and respiratory acid‐base disorders (C,D). AB, arterial blood; ACV, arterialized cephalic venous blood; BE, base excess; PCO2, partial pressure of carbon dioxide; [HCO3 −], bicarbonate concentration; 95% LoA, 95% limits of agreement.