
FIGURE 7.
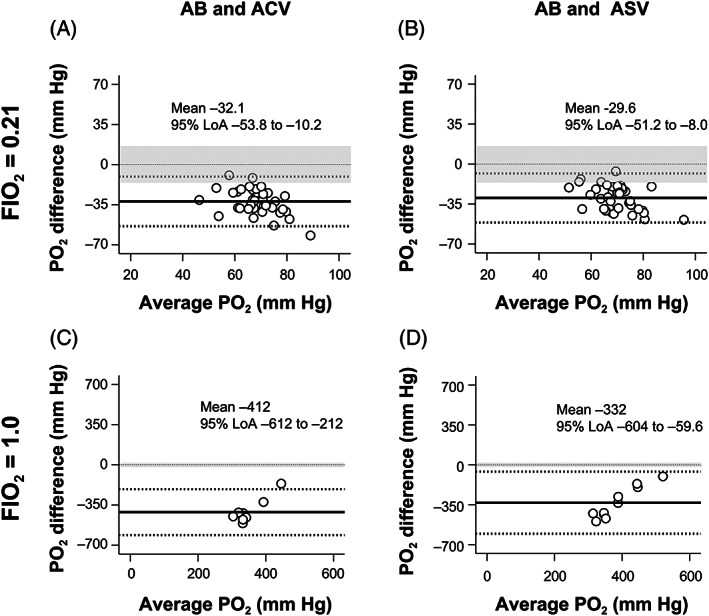
The Bland‐Altman plot analyses of the PO2 differences against the PO2 averages between the two measurements of the AB and ACV (A,C) and the AB and ASV (B,D) samples during O2 inhalation at FIO2 of 0.21 (A,B) and FIO2 of 1.0 (C,D). The central solid line represents the mean bias of measurements; the adjacent broken lines show the 95% LoA (±1.96 SD), and the thin dashed line is the best fit. The clinical allowable limits defined in the present study are shaded in gray. The PO2 values of the ACV and ASV samples showed no clinical agreement with those of the AB samples during O2 inhalation at FIO2 of 0.21 and FIO2 of 1.0. AB, arterial blood; ACV, arterialized cephalic venous blood; ASV, arterialized saphenous venous blood; FIO2, fraction of inspiratory oxygen; PO2, partial pressure of oxygen; 95% LoA, 95% limits of agreement.