
FIGURE 4.
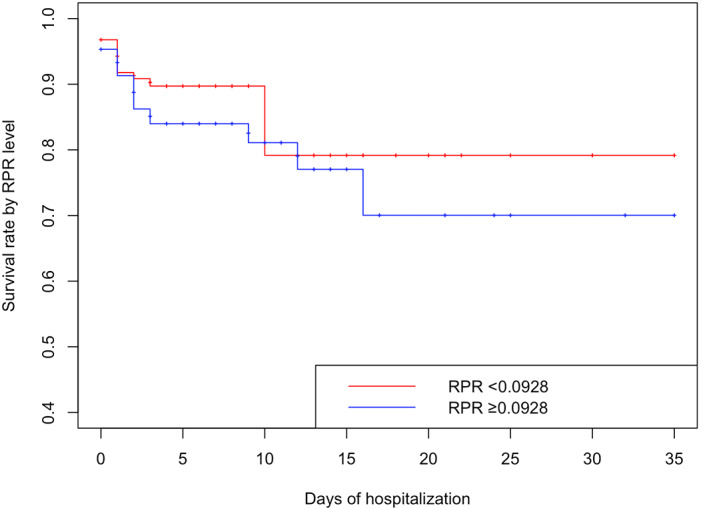
Kaplan‐Meier survival plot based on RPR levels (below and above the optimal cutoff of 0.0928).
Official websites use .gov
A
.gov website belongs to an official
government organization in the United States.
Secure .gov websites use HTTPS
A lock (
) or https:// means you've safely
connected to the .gov website. Share sensitive
information only on official, secure websites.
Kaplan‐Meier survival plot based on RPR levels (below and above the optimal cutoff of 0.0928).