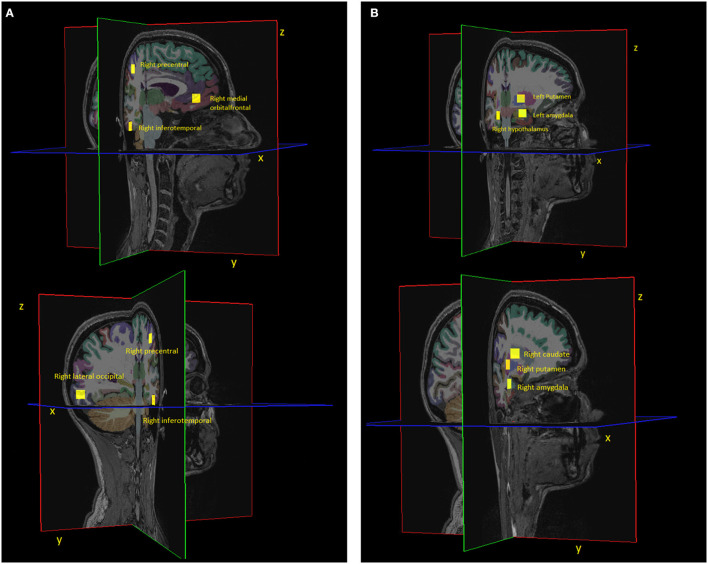
Figure 3.
Visualisation of (A) 4 cortical and (B) 4 subcortical regions together with their centroid (yellow square). Please note that the centroid is a single point, but we visualised it as a square in this figure for better visibility. The center of the square corresponds to the centroid coordinate. Due to viewing purposes, we only show half of the regions that were included in the analysis. The other half consists of the symmetrical regions in the respective other brain hemisphere.

