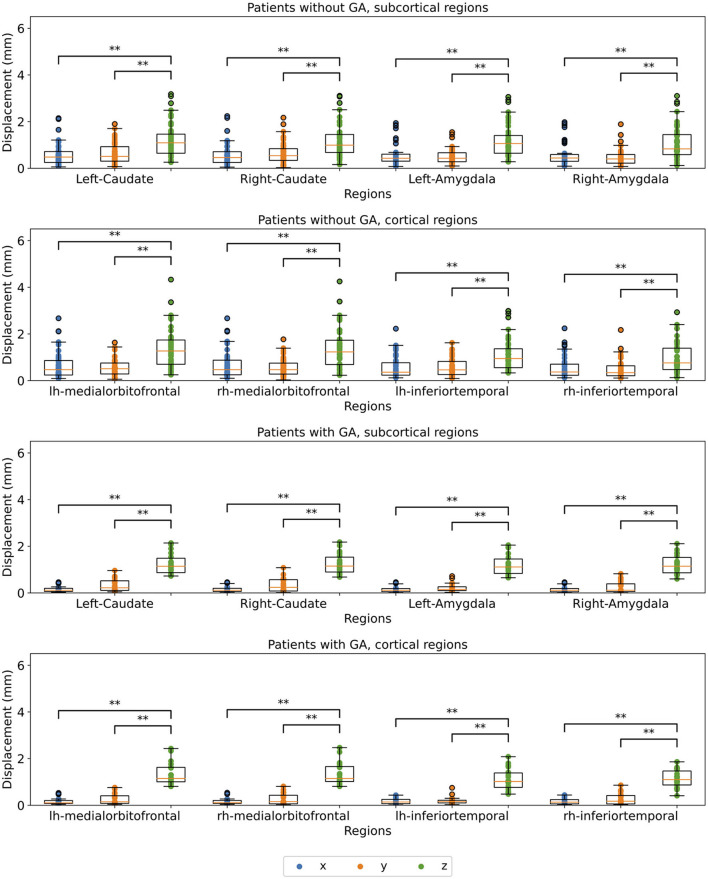
Figure 7.
Comparison of median displacement on each axis for 4 cortical and 4 subcortical regions split for the x-, y, and z-axis (blue, orange, and green, respectively). The upper two plots show patients without GA, the lower two patients with GA. Statistical significance after FDR correction is indicated by */** (p < 0.05/p < 0.001).

