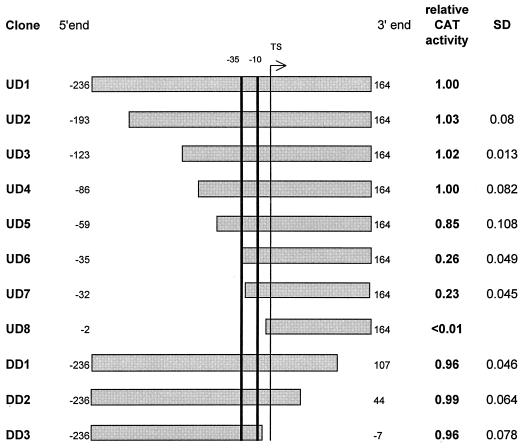
FIG. 1.
Deletion mapping of the promoter P-dapA. The horizontal shaded boxes represent the relative lengths of DNA fragments carrying the promoter studied. The 5′ and 3′ ends of the fragments relative to the TS are shown. The thick vertical bars mark the positions of potential −35 and −10 regions of the promoter. The vertical bar with an arrow on the top indicates the position of TS. PCR-generated fragments were cloned into pET2 to construct cat transcriptional fusions for determination of promoter activity. CAT activity is expressed relative to that measured with full-length fragment (UD1). Standard deviations (SD) from three independent measurements are shown.

