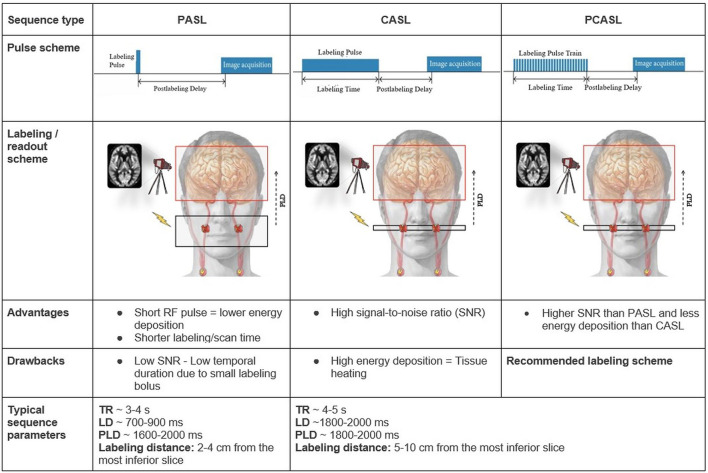
Figure 1.
Overview of the PASL, CASL, and PCASL techniques The red H circles in the schematic overview images represent water protons in the blood that get labeled — depicted as red X marks — by a radiofrequency pulse (flash) in the labeling plane in the internal carotid arteries. Other extracranial arteries are labeled too but are not depicted here. Advantages and drawbacks are in comparison between the techniques. LD: labeling duration; RF: radiofrequency; TR: repetition time.

