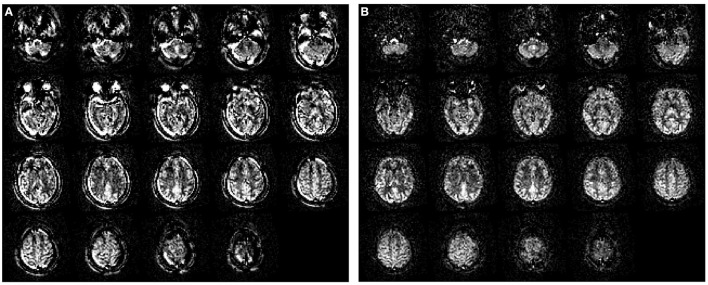
Figure 6.
The effect of motion correction. (A) Perfusion image without motion correction; (B) The same perfusion image after motion correction. Data were obtained with pseudo-continuous labeling and 2D EPI readout without background suppression on a Siemens scanner. The original data had a single yaw rotation (subject turning the head from left to right). Motion artifacts can be easily recognized by prominent patterns of very high and very low (i.e., negative) signals next to each other in areas where the static tissue has high contrast differences — visible as rims around the brain edge and skull.

