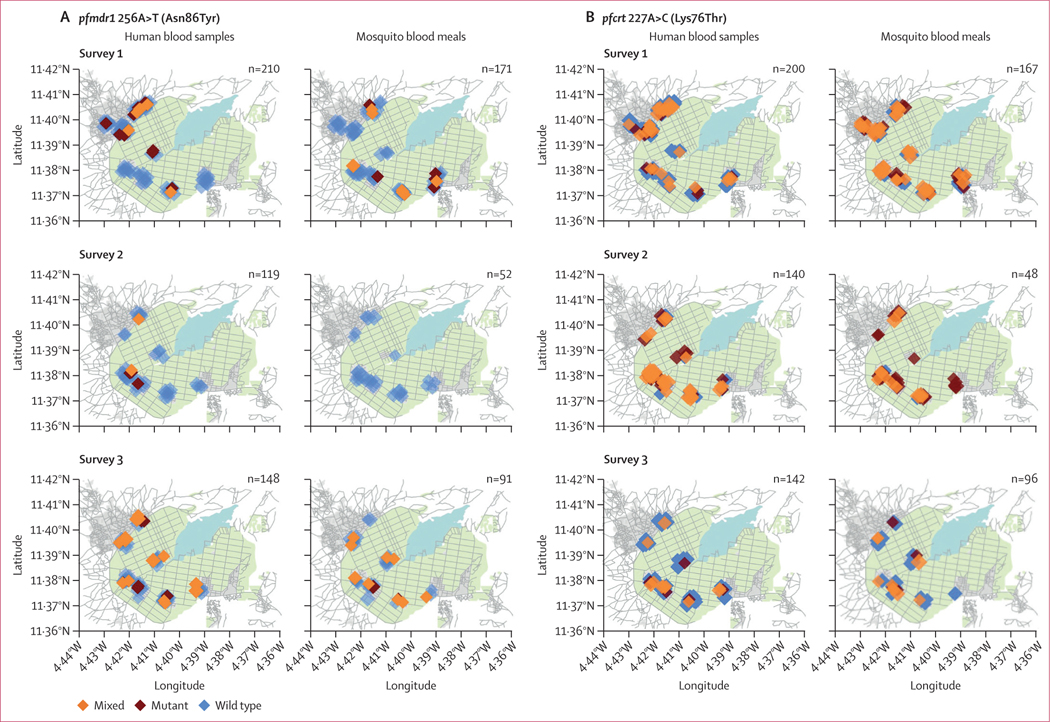
Figure 1: Spatial comparisons of allelic proportions in humans and mosquito blood meals.
(A) pfmdr1 256A>T (Asn86Tyr). (B) pfcrt 227A>C (Lys76Thr). Each diamond represents one genotyped sample, coloured according to genotype: wild type (blue), mutant (red), and mixed (orange). Background graphics include streets (lines, grey), farmland for rice cultivation (shaded, green) and lakes or marshland (shaded, blue); grey areas demarcate different village sectors. All geographic points are randomly jittered to protect anonymity. Sample sizes are shown in each panel. Maps adapted from OpenStreetMap.

