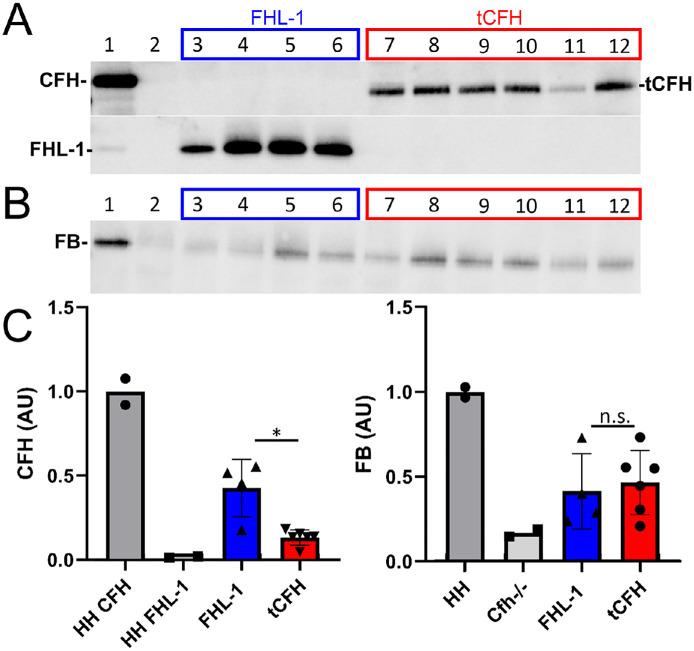
Figure 5.
Both FHL-1 and tCFH regulate complement activation in plasma. CFH (A) and FB (B) immunoblots of equal volumes of plasma collected from mice following tail vein injection of AAVs containing FHL-1 (blue) or tCFH (red), with expression driven by a liver-specific promoter. Lane 1 is a positive control for full-length CFH (CFH H/H plasma). Lane 2 was loaded with plasma from a non-injected Cfh–/– animal. (C) Densitometric analysis of immunoblots in A and B. The relative amount of expression measured by densitometry is depicted in the bar graph. The values are normalized to the endogenous CFH (left graph) or FB (right graph) in control plasma in lane 1 (HH). FHL-1 shows higher expression than tCFH, but there is no statistical difference in the amount of FB between the two AAV-injected groups. * P < 0.05.

