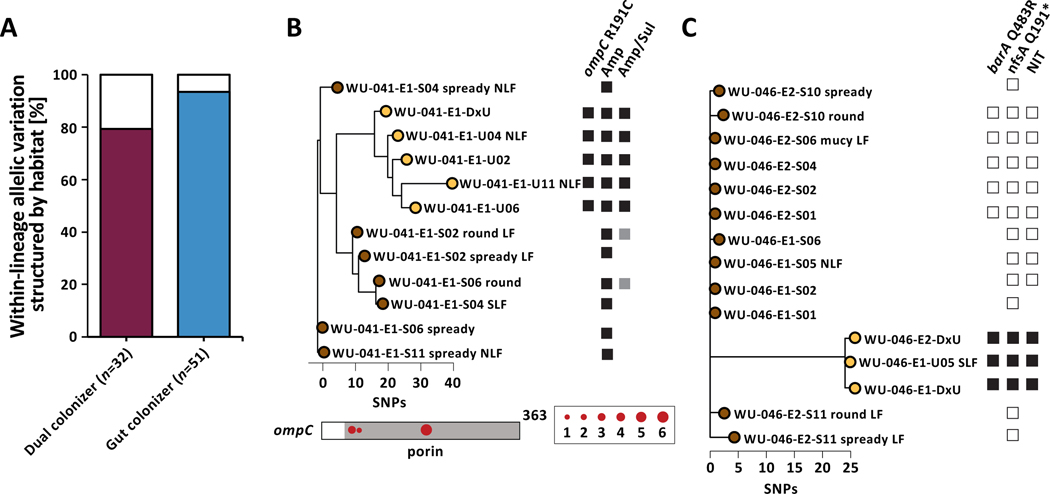
Figure 3 |. UPEC niche-specific adaptation impacts antibiotic resistance phenotypes.
(A) The majority of allelic diversity in genes found to be mutated in parallel within gut and dual colonizers is structured by habitat (Fisher’s exact test P=0.001). Color of the bar corresponds to either dual colonizer (maroon) or gut colonizers (blue). (B) (Top) Phylogeny of lineage WU-041_1 with annotated non-synonymous ompC mutation and corresponding phenotypic resistance to ampicillin/sulbactam. Black squares denote gene presence or antibiotic resistance. White squares indicate gene absence or drug susceptibility. Grey squares indicate intermediate drug susceptibility. Phylogeny is unrooted based on SNP distances. (Bottom) SNP locations on the ompC gene. The porin domain is annotated in grey. Circle size corresponds to number of isolates carrying that mutation. (C) Lineage WU-046_2 exhibited nonsynonymous barA and nfsA mutations in urinary isolates only, corresponding to phenotypic resistance to nitrofurantoin. Phylogeny is unrooted based on SNP distances. Labels as in (B).

