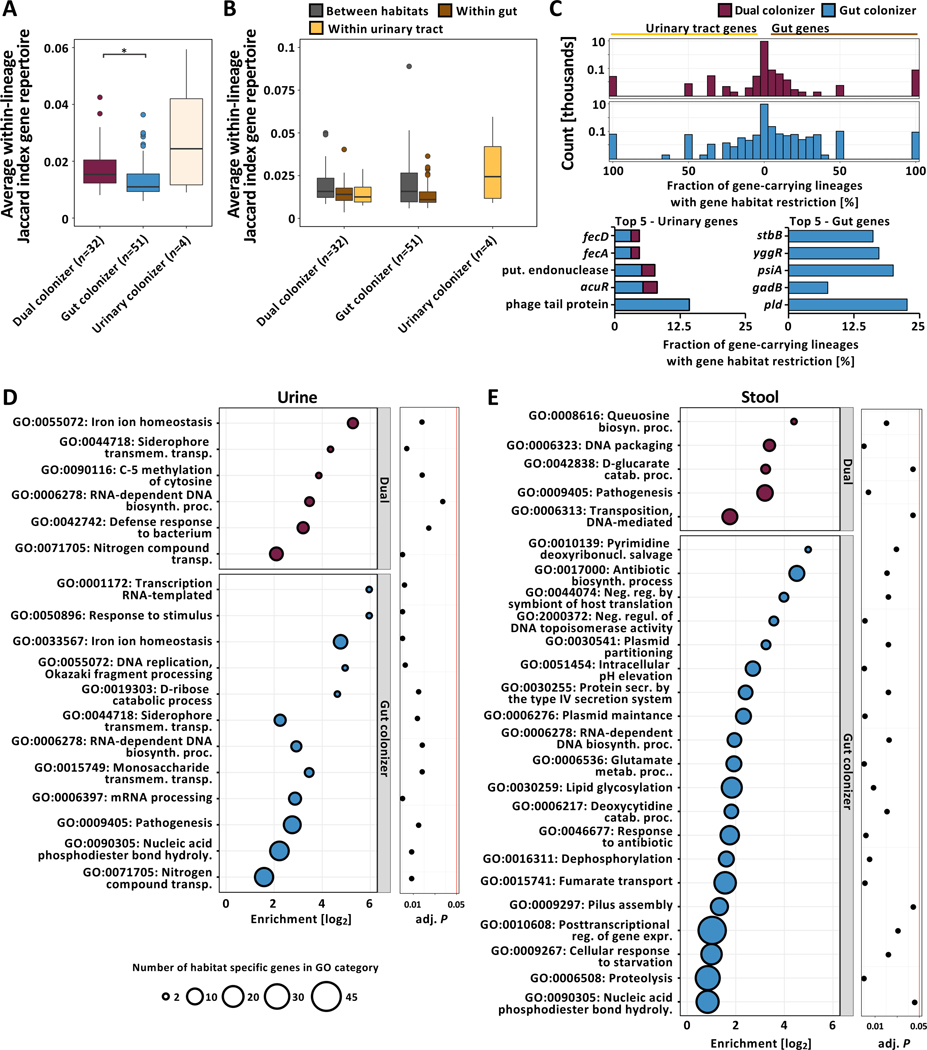
Figure 4 |. Persisting UPEC lineages exhibit niche-specific genomic plasticity.
(A) Boxplot of average within-lineage Jaccard distances based on gene presence/absence data (n=87 lineages, Kruskal-Wallis test P=0.009, Dunn post-hoc test gut vs dual colonizer P=0.012). Outliers (outside 1.5x interquartile range) are depicted as points. Whiskers represent 1.5x interquartile range. Upper, middle, and lower box lines indicate 75th, 50th, and 25th percentiles, respectively. (B) Average between- and within-habitat lineage Jaccard distances based on gene presence/absence data of same-lineage isolates by colonization type (n=87 lineages, Two-way ANOVA, habitat P=5.94e−4, colonization type P>0.05). Outliers (outside 1.5x interquartile range) are depicted as points. Whiskers represent 1.5x interquartile range. Upper, middle, and lower box lines indicate 75th, 50th, and 25th percentiles, respectively. Colors correspond to within-lineage comparison (between habitats: grey; within gut: brown; within urinary tract: yellow). (C) (Top) Two-sided histogram of within-lineage habitat-specific genes of dual (maroon) and gut (blue) colonizers. Urinary-specific genes are shown towards the left. Gut-specific genes are shown towards the right. (Bottom) Genes most frequently found to be urine (left) or gut (right) specific across lineages, normalized by the total number of gene-carrying lineages. Bar color corresponds to the colonization type a gene was found in as habitat specific. Hypothetical genes are not shown. (D) Overrepresented GO terms associated with urine specific genes of dual (top - maroon) or gut colonizers (bottom - blue). Bubble size corresponds to the number of habitat-specific genes in each GO term. (E) Overrepresented GO terms associated with stool specific genes, using the same formatting as in (D).

