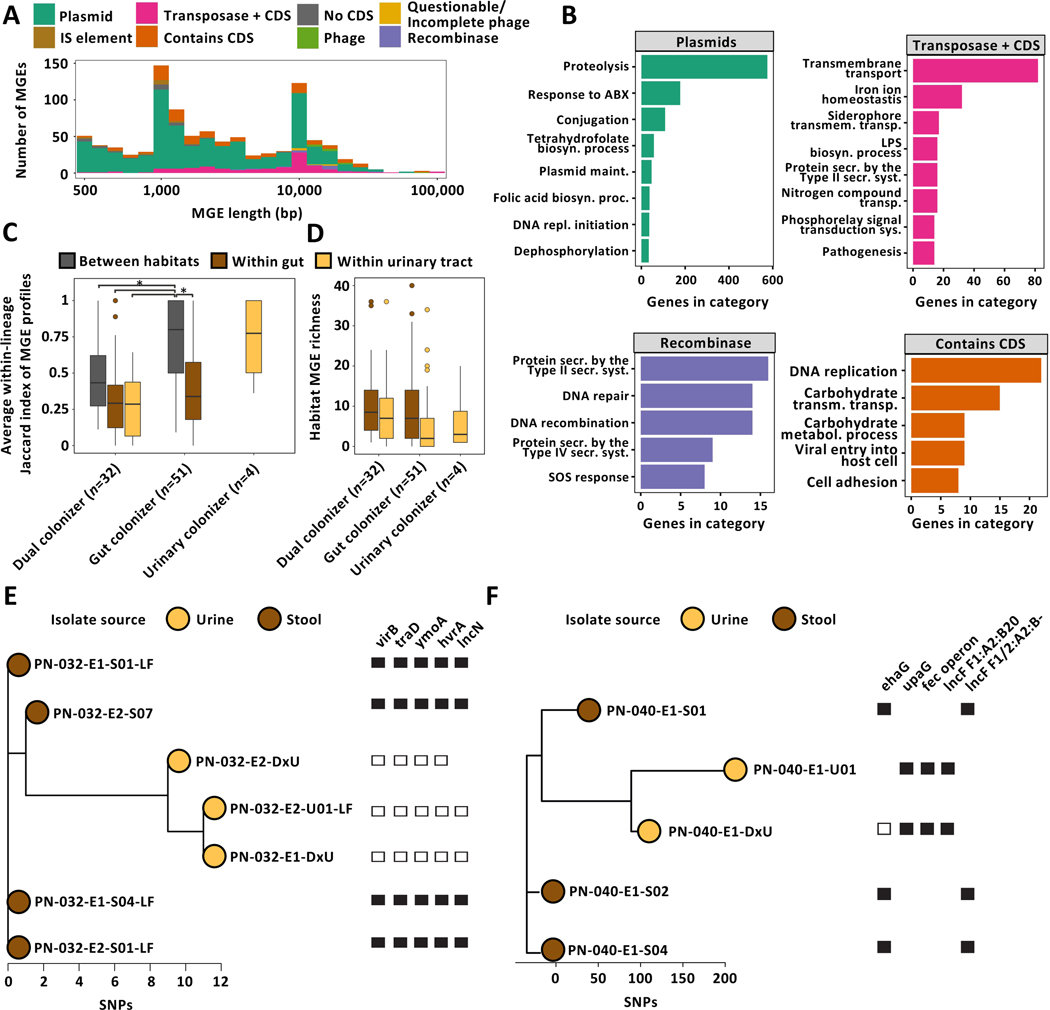
Figure 5 |. Mobile genetic elements drive niche-specific genomic plasticity of UPEC.
(A) Visualization of within-lineage MGEs. Element length (log-scale) is plotted against element count. IS, insertion sequence; CDS, coding sequence. (B) GO terms overrepresented in selected MGE subclasses. (C) Box plot of average within-lineage Jaccard distance based on MGE presence/absence data of same-lineage isolates between habitats (grey), within gut (brown), and within urine (yellow) grouped by colonization type. All comparisons are statistically significant (n=87 lineages, Two-way ANOVA P≤1.57e−05, Tukey post-hoc gut colonizer within-gut vs between habitats P<0.001, gut colonizer between habitat vs dual colonizer between habitat P=0.014). (D) MGE richness is larger in gut compared to urine isolates (n=87 lineages, Two-way ANOVA P=0.042). Outliers (outside 1.5x interquartile range) are depicted as points. Whiskers represent 1.5x interquartile range. Upper, middle, and lower box lines indicate 75th, 50th, and 25th percentiles, respectively. (E) Unrooted phylogeny of lineage PN-040_1 based on SNP distances annotated with selected habitat-specific genes. Relative short-read coverage over selected, habitat-specific MGEs harboring depicted genes is shown. (F) Unrooted phylogeny of lineage PN-004_1 based on SNP distances annotated with selected habitat-specific genes. Relative short-read coverage over selected, habitat-specific MGEs harboring depicted genes is shown.

