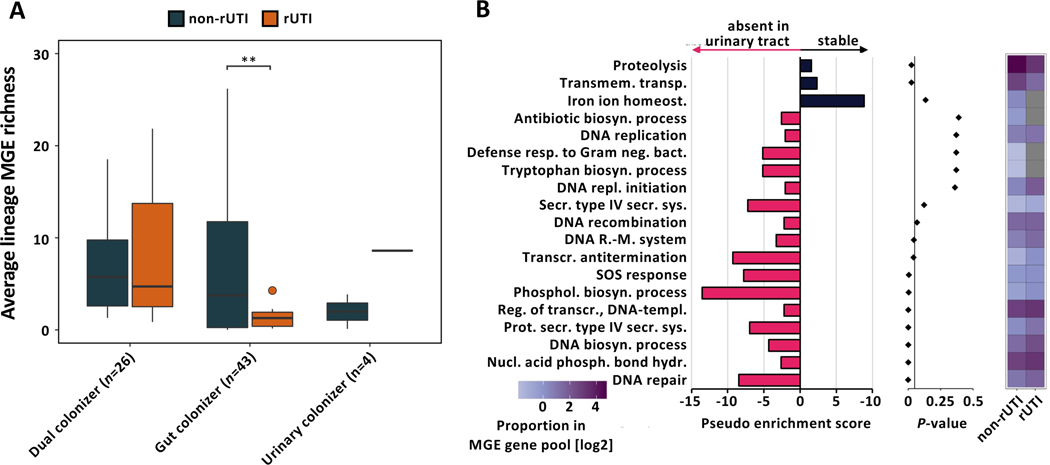
Figure 6 |. Gut colonizing UPEC lineages causing rUTI exhibit decreased MGE richness.
(A) MGE richness of lineages causing rUTI during the follow-up period and non-rUTI lineages parsed by colonization type (n=73 lineages, Welch’s t-test, FDR corrected gut colonizer P=0.001, dual and urinary colonizer FDR corrected P>0.05). Outliers (outside 1.5x interquartile range) are depicted as points. Whiskers represent 1.5x interquartile range. Upper, middle, and lower box lines indicate 75th, 50th, and 25th percentiles, respectively. (B) (Left) Pseudo enrichment score of GO terms in the pool of MGEs absent or stable in urinary isolates of gut colonizing UPEC lineages. Top 19 GO categories by P-value are visualized. Pink bars indicate gene associated GO terms overrepresented in the urine instable MGE pool, black bars indicate GO terms enriched in the pool of MGEs stable in urinary isolates. Pseudo enrichment score was calculated by adding one count to all GO categories. (Middle) P-values for each GO category determined from overrepresentation analysis using hypergeometric distribution. (Right) Proportion of each visualized GO term in the MGE associated gene pool of rUTI and non-rUTI causing lineages of gut colonizing UPEC. Grey tiles indicate absence of a GO term in the MGE gene pool.

