
Fig. 6.
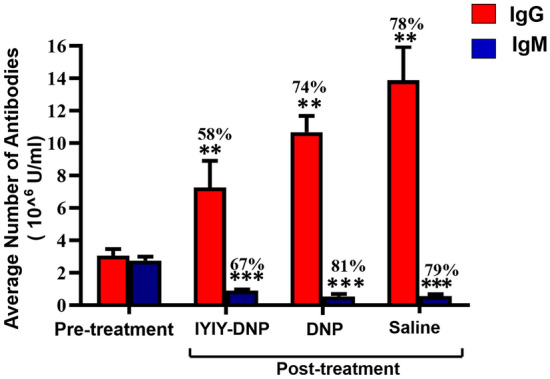
Average number of anti-DNP IgG and IgM antibodies calculated based on individual mouse in pre-treatment and post-treatment. The graph represents mean ± SEM of (n = 18) in pre-treatment, IYIY-DNP, DNP, and saline-treated mice. Values represent percentages of increased (IgG) and decreased (IgM) compared to pre-treatment. **p < 0.005 for post-treatment IYIY-DNP, DNP and control saline vs pre-treatment, ***p < 0.0001 for post-treatment IYIY-DNP, DNP and control saline vs pre-treatment, using independent T test