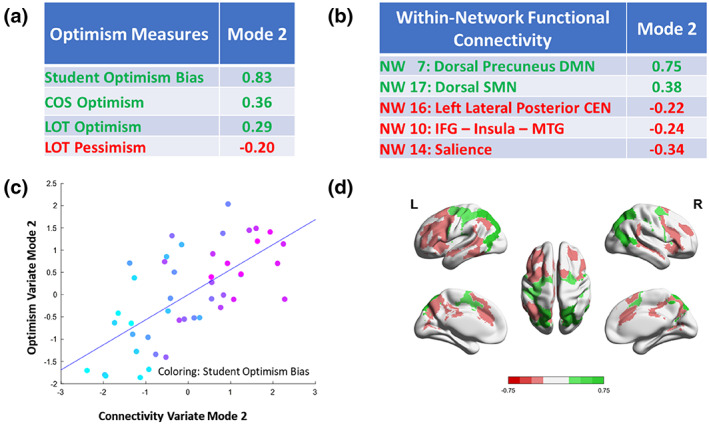
FIGURE 3.

Depiction of results for mode 2 of the sCCA. Panel (a): Weights greater than 0.2/lower than −0.2 for the optimism variate. (b) Weights greater than 0.2/lower than −0.2 for the network connectivity variate. (c) Scatter plot of the two variates. (d) Visual depiction of the networks and their weights. CEN, central executive network; COS, comparative optimism scale; DMN, default mode network; IFG, inferior frontal gyrus; LOT, life orientation test; MTG, medial temporal gyrus; NW, network; SMN, sensorimotor network.
